Mexican Wage/Income Gap
COMPARE
Mexican
Select to Compare
Wage/Income Gap
Mexican Wage/Income Gap
26.0%
WAGE/INCOME GAP
34.4/ 100
METRIC RATING
184th/ 347
METRIC RANK
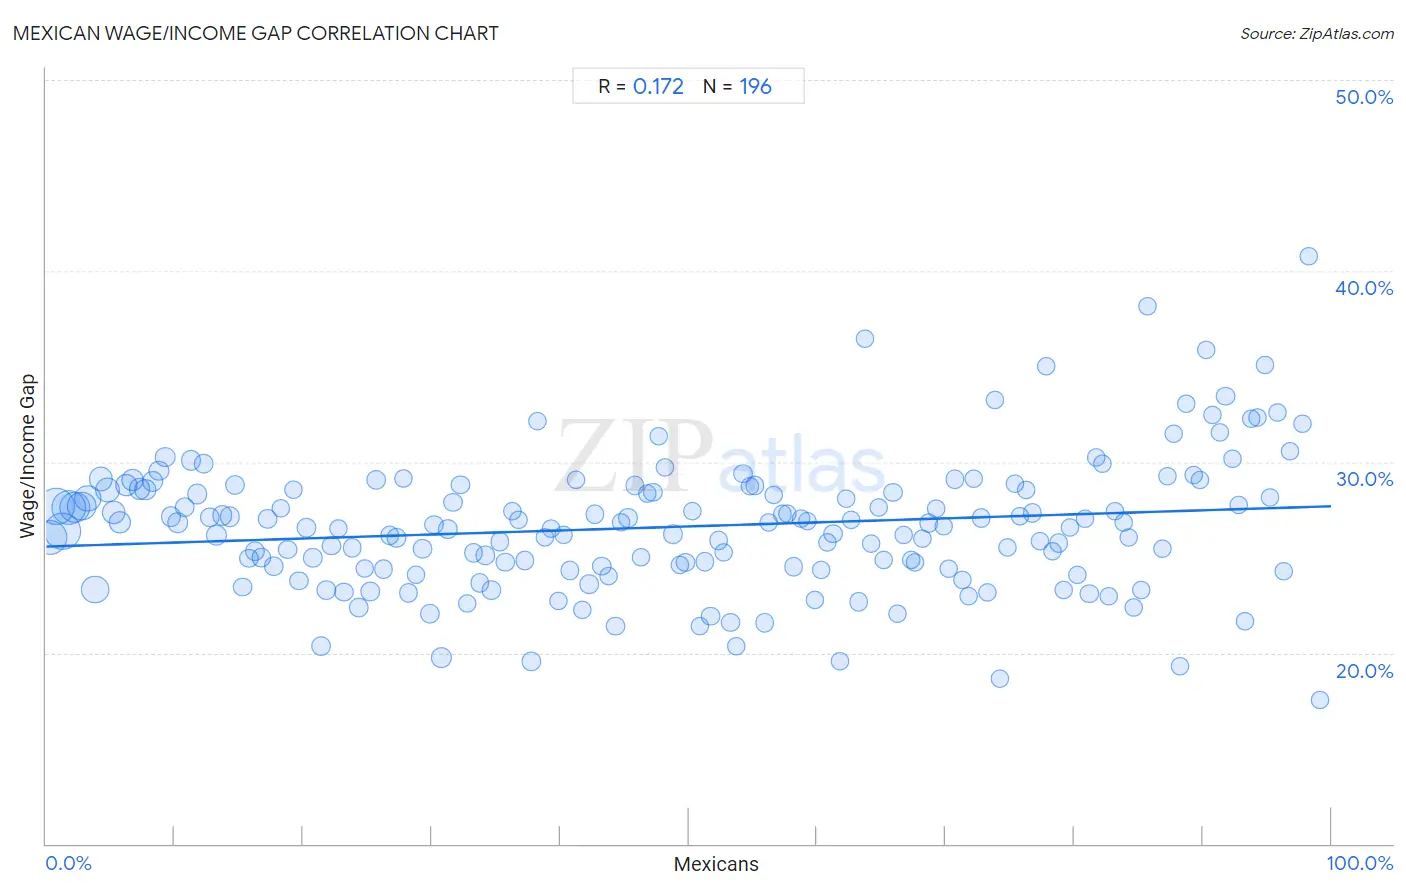
Mexican Wage/Income Gap Correlation Chart
The statistical analysis conducted on geographies consisting of 562,615,908 people shows a poor positive correlation between the proportion of Mexicans and wage/income gap percentage in the United States with a correlation coefficient (R) of 0.172 and weighted average of 26.0%. On average, for every 1% (one percent) increase in Mexicans within a typical geography, there is an increase of 0.021% in wage/income gap percentage.
It is essential to understand that the correlation between the percentage of Mexicans and wage/income gap percentage does not imply a direct cause-and-effect relationship. It remains uncertain whether the presence of Mexicans influences an upward or downward trend in the level of wage/income gap percentage within an area, or if Mexicans simply ended up residing in those areas with higher or lower levels of wage/income gap percentage due to other factors.
Demographics Similar to Mexicans by Wage/Income Gap
In terms of wage/income gap, the demographic groups most similar to Mexicans are Pakistani (26.1%, a difference of 0.050%), Immigrants from Kazakhstan (26.0%, a difference of 0.060%), Immigrants from Serbia (26.0%, a difference of 0.070%), Immigrants from Indonesia (26.1%, a difference of 0.13%), and Immigrants from Bolivia (26.0%, a difference of 0.14%).
| Demographics | Rating | Rank | Wage/Income Gap |
| Cambodians | 45.1 /100 | #177 | Average 25.8% |
| Chinese | 42.0 /100 | #178 | Average 25.9% |
| Samoans | 38.6 /100 | #179 | Fair 26.0% |
| Guamanians/Chamorros | 38.0 /100 | #180 | Fair 26.0% |
| Immigrants from Bolivia | 36.4 /100 | #181 | Fair 26.0% |
| Immigrants from Serbia | 35.4 /100 | #182 | Fair 26.0% |
| Immigrants from Kazakhstan | 35.2 /100 | #183 | Fair 26.0% |
| Mexicans | 34.4 /100 | #184 | Fair 26.0% |
| Pakistanis | 33.7 /100 | #185 | Fair 26.1% |
| Immigrants from Indonesia | 32.5 /100 | #186 | Fair 26.1% |
| Palestinians | 29.9 /100 | #187 | Fair 26.1% |
| Immigrants from Egypt | 29.9 /100 | #188 | Fair 26.1% |
| Immigrants from Moldova | 26.6 /100 | #189 | Fair 26.2% |
| Immigrants from Croatia | 24.8 /100 | #190 | Fair 26.2% |
| Immigrants from Venezuela | 24.7 /100 | #191 | Fair 26.2% |
Mexican Wage/Income Gap Correlation Summary
| Measurement | Mexican Data | Wage/Income Gap Data |
| Minimum | 0.28% | 17.6% |
| Maximum | 99.1% | 40.8% |
| Range | 98.9% | 23.2% |
| Mean | 49.1% | 26.6% |
| Median | 49.0% | 26.6% |
| Interquartile 25% (IQ1) | 24.5% | 24.5% |
| Interquartile 75% (IQ3) | 73.5% | 28.5% |
| Interquartile Range (IQR) | 49.0% | 4.1% |
| Standard Deviation (Sample) | 28.5% | 3.5% |
| Standard Deviation (Population) | 28.4% | 3.5% |
Correlation Details
| Mexican Percentile | Sample Size | Wage/Income Gap |
[ 0.0% - 0.5% ] 0.28% | 39,975,137 | 26.1% |
[ 0.5% - 1.0% ] 0.75% | 45,444,260 | 27.7% |
[ 1.0% - 1.5% ] 1.25% | 46,009,067 | 26.4% |
[ 1.5% - 2.0% ] 1.75% | 39,651,924 | 27.6% |
[ 2.0% - 2.5% ] 2.23% | 31,620,546 | 27.6% |
[ 2.5% - 3.0% ] 2.74% | 25,577,526 | 27.7% |
[ 3.0% - 3.5% ] 3.23% | 20,220,437 | 28.1% |
[ 3.5% - 4.0% ] 3.81% | 23,993,750 | 23.3% |
[ 4.0% - 4.5% ] 4.26% | 14,337,559 | 29.1% |
[ 4.5% - 5.0% ] 4.75% | 15,341,261 | 28.5% |
[ 5.0% - 5.5% ] 5.26% | 12,577,688 | 27.4% |
[ 5.5% - 6.0% ] 5.74% | 10,135,365 | 26.9% |
[ 6.0% - 6.5% ] 6.27% | 8,753,481 | 28.8% |
[ 6.5% - 7.0% ] 6.76% | 9,074,350 | 29.1% |
[ 7.0% - 7.5% ] 7.26% | 8,449,696 | 28.6% |
[ 7.5% - 8.0% ] 7.72% | 7,517,751 | 28.5% |
[ 8.0% - 8.5% ] 8.25% | 5,465,381 | 29.0% |
[ 8.5% - 9.0% ] 8.75% | 5,260,698 | 29.5% |
[ 9.0% - 9.5% ] 9.24% | 5,032,756 | 30.3% |
[ 9.5% - 10.0% ] 9.73% | 4,416,570 | 27.1% |
[ 10.0% - 10.5% ] 10.24% | 5,094,484 | 26.8% |
[ 10.5% - 11.0% ] 10.77% | 4,401,183 | 27.6% |
[ 11.0% - 11.5% ] 11.26% | 4,372,322 | 30.1% |
[ 11.5% - 12.0% ] 11.76% | 4,638,193 | 28.3% |
[ 12.0% - 12.5% ] 12.24% | 3,458,162 | 29.9% |
[ 12.5% - 13.0% ] 12.72% | 4,019,801 | 27.1% |
[ 13.0% - 13.5% ] 13.27% | 5,147,373 | 26.1% |
[ 13.5% - 14.0% ] 13.73% | 3,982,056 | 27.2% |
[ 14.0% - 14.5% ] 14.25% | 3,750,546 | 27.1% |
[ 14.5% - 15.0% ] 14.73% | 3,199,892 | 28.8% |
[ 15.0% - 15.5% ] 15.26% | 2,431,929 | 23.5% |
[ 15.5% - 16.0% ] 15.76% | 2,356,391 | 25.0% |
[ 16.0% - 16.5% ] 16.23% | 3,313,613 | 25.3% |
[ 16.5% - 17.0% ] 16.75% | 2,506,310 | 25.0% |
[ 17.0% - 17.5% ] 17.24% | 2,567,859 | 27.0% |
[ 17.5% - 18.0% ] 17.73% | 3,067,300 | 24.5% |
[ 18.0% - 18.5% ] 18.25% | 2,227,083 | 27.6% |
[ 18.5% - 19.0% ] 18.76% | 2,437,346 | 25.4% |
[ 19.0% - 19.5% ] 19.25% | 1,509,564 | 28.5% |
[ 19.5% - 20.0% ] 19.69% | 2,227,779 | 23.8% |
[ 20.0% - 20.5% ] 20.24% | 2,020,765 | 26.5% |
[ 20.5% - 21.0% ] 20.75% | 1,608,307 | 25.0% |
[ 21.0% - 21.5% ] 21.35% | 3,910,523 | 20.4% |
[ 21.5% - 22.0% ] 21.78% | 2,579,771 | 23.3% |
[ 22.0% - 22.5% ] 22.20% | 1,909,470 | 25.6% |
[ 22.5% - 23.0% ] 22.74% | 1,506,691 | 26.5% |
[ 23.0% - 23.5% ] 23.18% | 2,278,298 | 23.2% |
[ 23.5% - 24.0% ] 23.79% | 1,505,369 | 25.5% |
[ 24.0% - 24.5% ] 24.29% | 2,971,588 | 22.4% |
[ 24.5% - 25.0% ] 24.77% | 1,327,837 | 24.4% |
[ 25.0% - 25.5% ] 25.24% | 1,939,339 | 23.2% |
[ 25.5% - 26.0% ] 25.66% | 3,581,464 | 29.0% |
[ 26.0% - 26.5% ] 26.22% | 1,252,562 | 24.4% |
[ 26.5% - 27.0% ] 26.74% | 1,318,910 | 26.2% |
[ 27.0% - 27.5% ] 27.24% | 1,649,792 | 26.0% |
[ 27.5% - 28.0% ] 27.81% | 1,426,148 | 29.1% |
[ 28.0% - 28.5% ] 28.19% | 1,418,344 | 23.1% |
[ 28.5% - 29.0% ] 28.76% | 1,207,686 | 24.1% |
[ 29.0% - 29.5% ] 29.30% | 2,995,696 | 25.5% |
[ 29.5% - 30.0% ] 29.85% | 3,381,302 | 22.0% |
[ 30.0% - 30.5% ] 30.19% | 1,861,420 | 26.7% |
[ 30.5% - 31.0% ] 30.78% | 5,512,836 | 19.7% |
[ 31.0% - 31.5% ] 31.27% | 1,404,525 | 26.5% |
[ 31.5% - 32.0% ] 31.66% | 605,286 | 27.9% |
[ 32.0% - 32.5% ] 32.22% | 879,635 | 28.8% |
[ 32.5% - 33.0% ] 32.75% | 1,310,418 | 22.6% |
[ 33.0% - 33.5% ] 33.23% | 1,398,830 | 25.2% |
[ 33.5% - 34.0% ] 33.74% | 1,160,498 | 23.7% |
[ 34.0% - 34.5% ] 34.19% | 1,402,348 | 25.1% |
[ 34.5% - 35.0% ] 34.64% | 2,490,145 | 23.3% |
[ 35.0% - 35.5% ] 35.30% | 986,510 | 25.8% |
[ 35.5% - 36.0% ] 35.72% | 1,583,036 | 24.7% |
[ 36.0% - 36.5% ] 36.24% | 528,981 | 27.4% |
[ 36.5% - 37.0% ] 36.73% | 920,773 | 27.0% |
[ 37.0% - 37.5% ] 37.24% | 814,615 | 24.8% |
[ 37.5% - 38.0% ] 37.74% | 2,436,938 | 19.6% |
[ 38.0% - 38.5% ] 38.20% | 397,796 | 32.1% |
[ 38.5% - 39.0% ] 38.76% | 758,971 | 26.1% |
[ 39.0% - 39.5% ] 39.26% | 745,449 | 26.5% |
[ 39.5% - 40.0% ] 39.85% | 1,537,226 | 22.7% |
[ 40.0% - 40.5% ] 40.24% | 685,284 | 26.2% |
[ 40.5% - 41.0% ] 40.78% | 736,415 | 24.3% |
[ 41.0% - 41.5% ] 41.25% | 1,101,519 | 29.1% |
[ 41.5% - 42.0% ] 41.73% | 806,035 | 22.2% |
[ 42.0% - 42.5% ] 42.24% | 1,000,027 | 23.6% |
[ 42.5% - 43.0% ] 42.73% | 649,886 | 27.3% |
[ 43.0% - 43.5% ] 43.23% | 492,651 | 24.5% |
[ 43.5% - 44.0% ] 43.73% | 956,136 | 24.0% |
[ 44.0% - 44.5% ] 44.30% | 631,915 | 21.4% |
[ 44.5% - 45.0% ] 44.74% | 889,323 | 26.8% |
[ 45.0% - 45.5% ] 45.26% | 729,649 | 27.1% |
[ 45.5% - 46.0% ] 45.77% | 865,947 | 28.8% |
[ 46.0% - 46.5% ] 46.29% | 1,145,345 | 25.0% |
[ 46.5% - 47.0% ] 46.78% | 987,545 | 28.4% |
[ 47.0% - 47.5% ] 47.20% | 1,121,065 | 28.4% |
[ 47.5% - 48.0% ] 47.66% | 216,381 | 31.3% |
[ 48.0% - 48.5% ] 48.16% | 516,491 | 29.7% |
[ 48.5% - 49.0% ] 48.77% | 886,262 | 26.2% |
[ 49.0% - 49.5% ] 49.28% | 490,114 | 24.6% |
[ 49.5% - 50.0% ] 49.75% | 546,524 | 24.7% |
[ 50.0% - 50.5% ] 50.28% | 703,504 | 27.4% |
[ 50.5% - 51.0% ] 50.85% | 683,455 | 21.4% |
[ 51.0% - 51.5% ] 51.29% | 672,890 | 24.8% |
[ 51.5% - 52.0% ] 51.70% | 312,889 | 21.9% |
[ 52.0% - 52.5% ] 52.34% | 672,825 | 25.9% |
[ 52.5% - 53.0% ] 52.71% | 521,253 | 25.3% |
[ 53.0% - 53.5% ] 53.25% | 329,693 | 21.6% |
[ 53.5% - 54.0% ] 53.68% | 124,926 | 20.3% |
[ 54.0% - 54.5% ] 54.23% | 505,504 | 29.4% |
[ 54.5% - 55.0% ] 54.80% | 355,321 | 28.7% |
[ 55.0% - 55.5% ] 55.16% | 791,250 | 28.8% |
[ 55.5% - 56.0% ] 55.92% | 1,729,366 | 21.6% |
[ 56.0% - 56.5% ] 56.21% | 289,812 | 26.9% |
[ 56.5% - 57.0% ] 56.65% | 404,558 | 28.2% |
[ 57.0% - 57.5% ] 57.31% | 390,942 | 27.3% |
[ 57.5% - 58.0% ] 57.69% | 573,400 | 27.3% |
[ 58.0% - 58.5% ] 58.19% | 725,300 | 24.5% |
[ 58.5% - 59.0% ] 58.76% | 833,419 | 27.0% |
[ 59.0% - 59.5% ] 59.24% | 526,108 | 26.9% |
[ 59.5% - 60.0% ] 59.79% | 423,357 | 22.8% |
[ 60.0% - 60.5% ] 60.32% | 406,285 | 24.4% |
[ 60.5% - 61.0% ] 60.76% | 476,104 | 25.8% |
[ 61.0% - 61.5% ] 61.23% | 280,585 | 26.2% |
[ 61.5% - 62.0% ] 61.76% | 217,435 | 19.6% |
[ 62.0% - 62.5% ] 62.26% | 269,232 | 28.0% |
[ 62.5% - 63.0% ] 62.63% | 449,785 | 27.0% |
[ 63.0% - 63.5% ] 63.21% | 304,369 | 22.7% |
[ 63.5% - 64.0% ] 63.73% | 195,267 | 36.5% |
[ 64.0% - 64.5% ] 64.15% | 566,797 | 25.7% |
[ 64.5% - 65.0% ] 64.82% | 167,561 | 27.6% |
[ 65.0% - 65.5% ] 65.21% | 202,837 | 24.9% |
[ 65.5% - 66.0% ] 65.89% | 443,886 | 28.4% |
[ 66.0% - 66.5% ] 66.24% | 176,023 | 22.0% |
[ 66.5% - 67.0% ] 66.71% | 296,367 | 26.2% |
[ 67.0% - 67.5% ] 67.29% | 305,322 | 24.9% |
[ 67.5% - 68.0% ] 67.62% | 340,227 | 24.7% |
[ 68.0% - 68.5% ] 68.21% | 465,845 | 26.0% |
[ 68.5% - 69.0% ] 68.71% | 208,321 | 26.8% |
[ 69.0% - 69.5% ] 69.26% | 491,414 | 27.6% |
[ 69.5% - 70.0% ] 69.86% | 259,802 | 26.7% |
[ 70.0% - 70.5% ] 70.20% | 222,453 | 24.4% |
[ 70.5% - 71.0% ] 70.71% | 502,412 | 29.1% |
[ 71.0% - 71.5% ] 71.26% | 544,465 | 23.8% |
[ 71.5% - 72.0% ] 71.75% | 580,944 | 23.0% |
[ 72.0% - 72.5% ] 72.17% | 191,813 | 29.1% |
[ 72.5% - 73.0% ] 72.78% | 382,676 | 27.1% |
[ 73.0% - 73.5% ] 73.21% | 401,922 | 23.2% |
[ 73.5% - 74.0% ] 73.79% | 186,053 | 33.2% |
[ 74.0% - 74.5% ] 74.21% | 397,229 | 18.6% |
[ 74.5% - 75.0% ] 74.76% | 186,080 | 25.5% |
[ 75.0% - 75.5% ] 75.34% | 388,078 | 28.8% |
[ 75.5% - 76.0% ] 75.81% | 235,346 | 27.2% |
[ 76.0% - 76.5% ] 76.29% | 237,316 | 28.5% |
[ 76.5% - 77.0% ] 76.71% | 852,644 | 27.3% |
[ 77.0% - 77.5% ] 77.31% | 381,013 | 25.8% |
[ 77.5% - 78.0% ] 77.85% | 198,326 | 35.0% |
[ 78.0% - 78.5% ] 78.30% | 147,855 | 25.3% |
[ 78.5% - 79.0% ] 78.83% | 271,247 | 25.7% |
[ 79.0% - 79.5% ] 79.22% | 294,844 | 23.3% |
[ 79.5% - 80.0% ] 79.62% | 121,475 | 26.6% |
[ 80.0% - 80.5% ] 80.24% | 671,626 | 24.1% |
[ 80.5% - 81.0% ] 80.81% | 104,614 | 27.0% |
[ 81.0% - 81.5% ] 81.18% | 320,892 | 23.1% |
[ 81.5% - 82.0% ] 81.74% | 353,279 | 30.2% |
[ 82.0% - 82.5% ] 82.19% | 187,073 | 29.9% |
[ 82.5% - 83.0% ] 82.66% | 104,632 | 23.0% |
[ 83.0% - 83.5% ] 83.14% | 260,724 | 27.4% |
[ 83.5% - 84.0% ] 83.84% | 208,873 | 26.8% |
[ 84.0% - 84.5% ] 84.26% | 285,451 | 26.1% |
[ 84.5% - 85.0% ] 84.67% | 77,374 | 22.4% |
[ 85.0% - 85.5% ] 85.20% | 79,824 | 23.3% |
[ 85.5% - 86.0% ] 85.74% | 22,342 | 38.2% |
[ 86.5% - 87.0% ] 86.85% | 168,190 | 25.4% |
[ 87.0% - 87.5% ] 87.27% | 246,134 | 29.2% |
[ 87.5% - 88.0% ] 87.70% | 228,719 | 31.5% |
[ 88.0% - 88.5% ] 88.19% | 131,938 | 19.3% |
[ 88.5% - 89.0% ] 88.74% | 75,428 | 33.1% |
[ 89.0% - 89.5% ] 89.27% | 141,856 | 29.3% |
[ 89.5% - 90.0% ] 89.81% | 315,055 | 29.0% |
[ 90.0% - 90.5% ] 90.22% | 359,604 | 35.9% |
[ 90.5% - 91.0% ] 90.73% | 198,315 | 32.4% |
[ 91.0% - 91.5% ] 91.34% | 513,258 | 31.6% |
[ 91.5% - 92.0% ] 91.78% | 288,364 | 33.4% |
[ 92.0% - 92.5% ] 92.33% | 53,138 | 30.2% |
[ 92.5% - 93.0% ] 92.78% | 175,026 | 27.7% |
[ 93.0% - 93.5% ] 93.28% | 92,647 | 21.7% |
[ 93.5% - 94.0% ] 93.77% | 99,189 | 32.3% |
[ 94.0% - 94.5% ] 94.26% | 174,137 | 32.3% |
[ 94.5% - 95.0% ] 94.80% | 115,986 | 35.1% |
[ 95.0% - 95.5% ] 95.27% | 67,762 | 28.1% |
[ 95.5% - 96.0% ] 95.84% | 22,985 | 32.6% |
[ 96.0% - 96.5% ] 96.26% | 18,946 | 24.3% |
[ 96.5% - 97.0% ] 96.75% | 22,416 | 30.6% |
[ 97.5% - 98.0% ] 97.76% | 39,234 | 32.0% |
[ 98.0% - 98.5% ] 98.24% | 15,783 | 40.8% |
[ 99.0% - 99.5% ] 99.13% | 12,666 | 17.6% |