Immigrants from Fiji Wage/Income Gap

COMPARE

Immigrants from Fiji
Race
Ancestry
AfghanAfricanAlaska NativeAlaskan AthabascanAlbanianAleutAlsatianAmericanApacheArabArapahoArgentineanArmenianAssyrian/Chaldean/SyriacAustralianAustrianBahamianBangladeshiBarbadianBasqueBelgianBelizeanBermudanBhutaneseBlackfeetBolivianBrazilianBritishBritish West IndianBulgarianBurmeseCajunCambodianCanadianCape VerdeanCarpatho RusynCelticCentral AmericanCentral American IndianCherokeeCheyenneChickasawChileanChineseChippewaChoctawColombianColvilleComancheCosta RicanCreeCreekCroatianCrowCubanCypriotCzechCzechoslovakianDanishDelawareDominicanDutchDutch West IndianEastern EuropeanEcuadorianEgyptianEnglishEstonianEthiopianEuropeanFijianFilipinoFinnishFrenchFrench American IndianFrench CanadianGermanGerman RussianGhanaianGreekGuamanian/ChamorroGuatemalanGuyaneseHaitianHmongHonduranHopiHoumaHungarianIcelanderIndian (Asian)IndonesianInupiatIranianIraqiIrishIroquoisIsraeliItalianJamaicanJapaneseJordanianKenyanKiowaKoreanLaotianLatvianLebaneseLiberianLithuanianLumbeeLuxembourgerMacedonianMalaysianMalteseMarshalleseMenomineeMexicanMexican American IndianMongolianMoroccanNative HawaiianNavajoNepaleseNew ZealanderNicaraguanNigerianNorthern EuropeanNorwegianOkinawanOsageOttawaPaiutePakistaniPalestinianPanamanianParaguayanPennsylvania GermanPeruvianPimaPolishPortuguesePotawatomiPuebloPuerto RicanPuget Sound SalishRomanianRussianSalvadoranSamoanScandinavianScotch-IrishScottishSeminoleSenegaleseSerbianShoshoneSierra LeoneanSiouxSlavicSlovakSloveneSomaliSouth AfricanSouth AmericanSouth American IndianSoviet UnionSpaniardSpanishSpanish AmericanSpanish American IndianSri LankanSubsaharan AfricanSudaneseSwedishSwissSyrianTaiwaneseThaiTlingit-HaidaTohono O'OdhamTonganTrinidadian and TobagonianTsimshianTurkishU.S. Virgin IslanderUgandanUkrainianUruguayanUteVenezuelanVietnameseWelshWest IndianYakamaYaquiYugoslavianYumanYup'ikZimbabwean
Immigration
NonimmigrantsImmigrantsAfghanistanAfricaAlbaniaArgentinaArmeniaAsiaAustraliaAustriaBahamasBangladeshBarbadosBelarusBelgiumBelizeBoliviaBosnia and HerzegovinaBrazilBulgariaBurma/MyanmarCabo VerdeCambodiaCameroonCanadaCaribbeanCentral AmericaChileChinaColombiaCongoCosta RicaCroatiaCubaCzechoslovakiaDenmarkDominicaDominican RepublicEastern AfricaEastern AsiaEastern EuropeEcuadorEgyptEl SalvadorEnglandEritreaEthiopiaEuropeFijiFranceGermanyGhanaGreeceGrenadaGuatemalaGuyanaHaitiHondurasHong KongHungaryIndiaIndonesiaIranIraqIrelandIsraelItalyJamaicaJapanJordanKazakhstanKenyaKoreaKuwaitLaosLatin AmericaLatviaLebanonLiberiaLithuaniaMalaysiaMexicoMicronesiaMiddle AfricaMoldovaMoroccoNepalNetherlandsNicaraguaNigeriaNorth AmericaNorth MacedoniaNorthern AfricaNorthern EuropeNorwayOceaniaPakistanPanamaPeruPhilippinesPolandPortugalRomaniaRussiaSaudi ArabiaScotlandSenegalSerbiaSierra LeoneSingaporeSomaliaSouth AfricaSouth AmericaSouth Central AsiaSouth Eastern AsiaSouthern EuropeSpainSri LankaSt. Vincent and the GrenadinesSudanSwedenSwitzerlandSyriaTaiwanThailandTrinidad and TobagoTurkeyUgandaUkraineUruguayUzbekistanVenezuelaVietnamWest IndiesWestern AfricaWestern AsiaWestern EuropeYemenZaireZimbabweAzores
Select to Compare
Race
Ancestry
AfghanAfricanAlaska NativeAlaskan AthabascanAlbanianAleutAlsatianAmericanApacheArabArapahoArgentineanArmenianAssyrian/Chaldean/SyriacAustralianAustrianBahamianBangladeshiBarbadianBasqueBelgianBelizeanBermudanBhutaneseBlackfeetBolivianBrazilianBritishBritish West IndianBulgarianBurmeseCajunCambodianCanadianCape VerdeanCarpatho RusynCelticCentral AmericanCentral American IndianCherokeeCheyenneChickasawChileanChineseChippewaChoctawColombianColvilleComancheCosta RicanCreeCreekCroatianCrowCubanCypriotCzechCzechoslovakianDanishDelawareDominicanDutchDutch West IndianEastern EuropeanEcuadorianEgyptianEnglishEstonianEthiopianEuropeanFijianFilipinoFinnishFrenchFrench American IndianFrench CanadianGermanGerman RussianGhanaianGreekGuamanian/ChamorroGuatemalanGuyaneseHaitianHmongHonduranHopiHoumaHungarianIcelanderIndian (Asian)IndonesianInupiatIranianIraqiIrishIroquoisIsraeliItalianJamaicanJapaneseJordanianKenyanKiowaKoreanLaotianLatvianLebaneseLiberianLithuanianLumbeeLuxembourgerMacedonianMalaysianMalteseMarshalleseMenomineeMexicanMexican American IndianMongolianMoroccanNative HawaiianNavajoNepaleseNew ZealanderNicaraguanNigerianNorthern EuropeanNorwegianOkinawanOsageOttawaPaiutePakistaniPalestinianPanamanianParaguayanPennsylvania GermanPeruvianPimaPolishPortuguesePotawatomiPuebloPuerto RicanPuget Sound SalishRomanianRussianSalvadoranSamoanScandinavianScotch-IrishScottishSeminoleSenegaleseSerbianShoshoneSierra LeoneanSiouxSlavicSlovakSloveneSomaliSouth AfricanSouth AmericanSouth American IndianSoviet UnionSpaniardSpanishSpanish AmericanSpanish American IndianSri LankanSubsaharan AfricanSudaneseSwedishSwissSyrianTaiwaneseThaiTlingit-HaidaTohono O'OdhamTonganTrinidadian and TobagonianTsimshianTurkishU.S. Virgin IslanderUgandanUkrainianUruguayanUteVenezuelanVietnameseWelshWest IndianYakamaYaquiYugoslavianYumanYup'ikZimbabwean
Immigration
NonimmigrantsImmigrantsAfghanistanAfricaAlbaniaArgentinaArmeniaAsiaAustraliaAustriaBahamasBangladeshBarbadosBelarusBelgiumBelizeBoliviaBosnia and HerzegovinaBrazilBulgariaBurma/MyanmarCabo VerdeCambodiaCameroonCanadaCaribbeanCentral AmericaChileChinaColombiaCongoCosta RicaCroatiaCubaCzechoslovakiaDenmarkDominicaDominican RepublicEastern AfricaEastern AsiaEastern EuropeEcuadorEgyptEl SalvadorEnglandEritreaEthiopiaEuropeFranceGermanyGhanaGreeceGrenadaGuatemalaGuyanaHaitiHondurasHong KongHungaryIndiaIndonesiaIranIraqIrelandIsraelItalyJamaicaJapanJordanKazakhstanKenyaKoreaKuwaitLaosLatin AmericaLatviaLebanonLiberiaLithuaniaMalaysiaMexicoMicronesiaMiddle AfricaMoldovaMoroccoNepalNetherlandsNicaraguaNigeriaNorth AmericaNorth MacedoniaNorthern AfricaNorthern EuropeNorwayOceaniaPakistanPanamaPeruPhilippinesPolandPortugalRomaniaRussiaSaudi ArabiaScotlandSenegalSerbiaSierra LeoneSingaporeSomaliaSouth AfricaSouth AmericaSouth Central AsiaSouth Eastern AsiaSouthern EuropeSpainSri LankaSt. Vincent and the GrenadinesSudanSwedenSwitzerlandSyriaTaiwanThailandTrinidad and TobagoTurkeyUgandaUkraineUruguayUzbekistanVenezuelaVietnamWest IndiesWestern AfricaWestern AsiaWestern EuropeYemenZaireZimbabweAzores
Wage/Income Gap
Income
Poverty
Unemployment
Labor Participation
Family Structure
Vehicle Availability
Education Level
Disability

Immigrants from Fiji Wage/Income Gap
Exceptional

22.4%
WAGE/INCOME GAP
100.0/ 100
METRIC RATING
61st/ 347
METRIC RANK

Immigrants from Fiji Wage/Income Gap Correlation Chart

The statistical analysis conducted on geographies consisting of 93,739,625 people shows a poor negative correlation between the proportion of Immigrants from Fiji and wage/income gap percentage in the United States with a correlation coefficient (R) of -0.127 and weighted average of 22.4%. On average, for every 1% (one percent) increase in Immigrants from Fiji within a typical geography, there is a decrease of 1.6% in wage/income gap percentage.
Immigrants from Fiji Wage/Income Gap
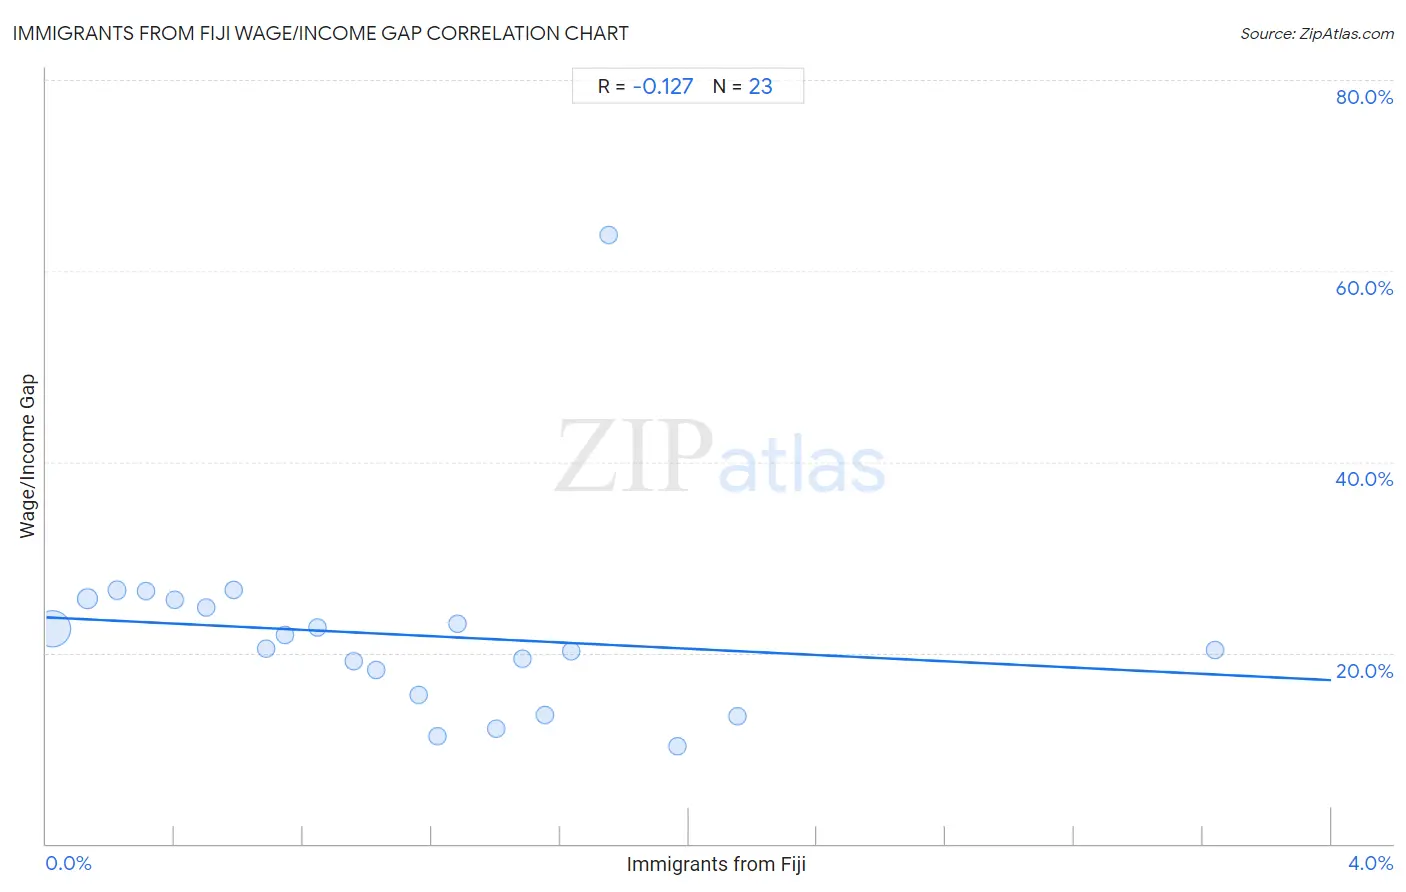
It is essential to understand that the correlation between the percentage of Immigrants from Fiji and wage/income gap percentage does not imply a direct cause-and-effect relationship. It remains uncertain whether the presence of Immigrants from Fiji influences an upward or downward trend in the level of wage/income gap percentage within an area, or if Immigrants from Fiji simply ended up residing in those areas with higher or lower levels of wage/income gap percentage due to other factors.

Demographics Similar to Immigrants from Fiji by Wage/Income Gap

In terms of wage/income gap, the demographic groups most similar to Immigrants from Fiji are Immigrants from Middle Africa (22.4%, a difference of 0.17%), Navajo (22.4%, a difference of 0.19%), Immigrants from Guatemala (22.5%, a difference of 0.21%), Immigrants from Cuba (22.4%, a difference of 0.23%), and Ghanaian (22.3%, a difference of 0.31%).
DemographicsRating | RankWage/Income Gap
Nepalese
100.0
/100
|
#54
Exceptional
22.2%
Immigrants from Zaire
100.0
/100
|
#55
Exceptional
22.3%
Immigrants from Ghana
100.0
/100
|
#56
Exceptional
22.3%
Ghanaians
100.0
/100
|
#57
Exceptional
22.3%
Immigrants from Cuba
100.0
/100
|
#58
Exceptional
22.4%
Navajo
100.0
/100
|
#59
Exceptional
22.4%
Immigrants from Middle Africa
100.0
/100
|
#60
Exceptional
22.4%
Immigrants from Fiji
100.0
/100
|
#61
Exceptional
22.4%
Immigrants from Guatemala
100.0
/100
|
#62
Exceptional
22.5%
Immigrants from Ecuador
100.0
/100
|
#63
Exceptional
22.5%
Spanish American Indians
100.0
/100
|
#64
Exceptional
22.5%
Guatemalans
99.9
/100
|
#65
Exceptional
22.6%
Central American Indians
99.9
/100
|
#66
Exceptional
22.7%
Menominee
99.9
/100
|
#67
Exceptional
22.7%
Immigrants from Nigeria
99.9
/100
|
#68
Exceptional
22.7%

Immigrants from Fiji Wage/Income Gap Correlation Summary

MeasurementImmigrants from Fiji DataWage/Income Gap Data
Minimum0.020%10.2%
Maximum3.6%63.8%
Range3.6%53.5%
Mean1.1%21.9%
Median1.0%20.5%
Interquartile 25% (IQ1)0.50%15.6%
Interquartile 75% (IQ3)1.6%25.6%
Interquartile Range (IQR)1.1%10.0%
Standard Deviation (Sample)0.81%10.5%
Standard Deviation (Population)0.79%10.3%

Correlation Details

Immigrants from Fiji PercentileSample SizeWage/Income Gap
[
0.0%
-
0.5%
]
0.020%
73,451,04522.6%
[
0.0%
-
0.5%
]
0.13%
9,801,78325.7%
[
0.0%
-
0.5%
]
0.22%
3,283,37026.6%
[
0.0%
-
0.5%
]
0.31%
1,978,28926.5%
[
0.0%
-
0.5%
]
0.40%
1,495,89525.6%
[
0.0%
-
0.5%
]
0.50%
213,80624.8%
[
0.5%
-
1.0%
]
0.58%
531,55626.6%
[
0.5%
-
1.0%
]
0.68%
646,78220.5%
[
0.5%
-
1.0%
]
0.74%
380,95521.9%
[
0.5%
-
1.0%
]
0.84%
175,08722.7%
[
0.5%
-
1.0%
]
0.96%
116,49819.2%
[
1.0%
-
1.5%
]
1.03%
279,36418.2%
[
1.0%
-
1.5%
]
1.16%
609,30515.6%
[
1.0%
-
1.5%
]
1.22%
14,29111.3%
[
1.0%
-
1.5%
]
1.28%
199,40523.0%
[
1.0%
-
1.5%
]
1.40%
110,92912.0%
[
1.0%
-
1.5%
]
1.48%
85,41019.3%
[
1.5%
-
2.0%
]
1.55%
83,82113.4%
[
1.5%
-
2.0%
]
1.63%
77,71220.1%
[
1.5%
-
2.0%
]
1.75%
5,77463.8%
[
1.5%
-
2.0%
]
1.96%
60,85010.2%
[
2.0%
-
2.5%
]
2.15%
41,59913.3%
[
3.5%
-
4.0%
]
3.64%
96,09920.3%