Chippewa Wage/Income Gap
COMPARE
Chippewa
Select to Compare
Wage/Income Gap
Chippewa Wage/Income Gap
25.0%
WAGE/INCOME GAP
86.9/ 100
METRIC RATING
144th/ 347
METRIC RANK
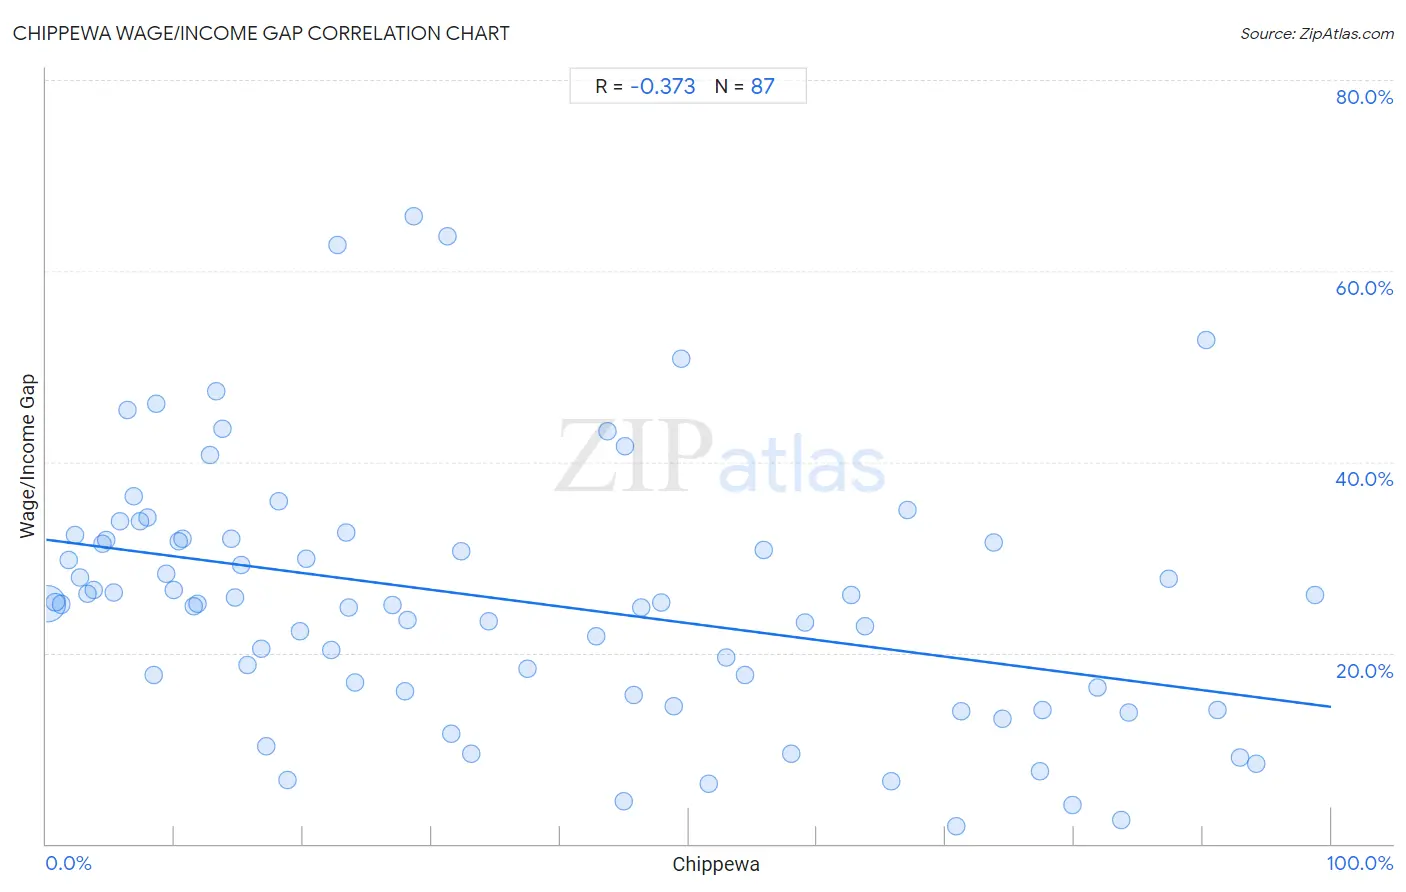
Chippewa Wage/Income Gap Correlation Chart
The statistical analysis conducted on geographies consisting of 214,916,578 people shows a mild negative correlation between the proportion of Chippewa and wage/income gap percentage in the United States with a correlation coefficient (R) of -0.373 and weighted average of 25.0%. On average, for every 1% (one percent) increase in Chippewa within a typical geography, there is a decrease of 0.18% in wage/income gap percentage.
It is essential to understand that the correlation between the percentage of Chippewa and wage/income gap percentage does not imply a direct cause-and-effect relationship. It remains uncertain whether the presence of Chippewa influences an upward or downward trend in the level of wage/income gap percentage within an area, or if Chippewa simply ended up residing in those areas with higher or lower levels of wage/income gap percentage due to other factors.
Demographics Similar to Chippewa by Wage/Income Gap
In terms of wage/income gap, the demographic groups most similar to Chippewa are Immigrants from Uganda (24.9%, a difference of 0.18%), Afghan (24.9%, a difference of 0.19%), Comanche (25.0%, a difference of 0.24%), South American (25.0%, a difference of 0.24%), and Malaysian (25.0%, a difference of 0.27%).
| Demographics | Rating | Rank | Wage/Income Gap |
| Immigrants from South Eastern Asia | 90.9 /100 | #137 | Exceptional 24.8% |
| Immigrants from Bosnia and Herzegovina | 90.1 /100 | #138 | Exceptional 24.8% |
| Hispanics or Latinos | 89.5 /100 | #139 | Excellent 24.9% |
| Immigrants from Nepal | 89.3 /100 | #140 | Excellent 24.9% |
| Hawaiians | 89.3 /100 | #141 | Excellent 24.9% |
| Afghans | 88.1 /100 | #142 | Excellent 24.9% |
| Immigrants from Uganda | 88.0 /100 | #143 | Excellent 24.9% |
| Chippewa | 86.9 /100 | #144 | Excellent 25.0% |
| Comanche | 85.2 /100 | #145 | Excellent 25.0% |
| South Americans | 85.2 /100 | #146 | Excellent 25.0% |
| Malaysians | 84.9 /100 | #147 | Excellent 25.0% |
| Iroquois | 83.9 /100 | #148 | Excellent 25.1% |
| Immigrants from Peru | 82.6 /100 | #149 | Excellent 25.1% |
| Immigrants | 82.3 /100 | #150 | Excellent 25.1% |
| Taiwanese | 81.6 /100 | #151 | Excellent 25.1% |
Chippewa Wage/Income Gap Correlation Summary
| Measurement | Chippewa Data | Wage/Income Gap Data |
| Minimum | 0.066% | 1.9% |
| Maximum | 98.7% | 65.8% |
| Range | 98.7% | 63.9% |
| Mean | 35.8% | 25.6% |
| Median | 27.9% | 25.2% |
| Interquartile 25% (IQ1) | 10.6% | 16.0% |
| Interquartile 75% (IQ3) | 58.0% | 31.9% |
| Interquartile Range (IQR) | 47.3% | 15.9% |
| Standard Deviation (Sample) | 28.8% | 13.5% |
| Standard Deviation (Population) | 28.6% | 13.4% |
Correlation Details
| Chippewa Percentile | Sample Size | Wage/Income Gap |
[ 0.0% - 0.5% ] 0.066% | 204,781,264 | 25.2% |
[ 0.5% - 1.0% ] 0.70% | 6,208,553 | 25.3% |
[ 1.0% - 1.5% ] 1.16% | 1,898,547 | 25.1% |
[ 1.5% - 2.0% ] 1.72% | 530,452 | 29.8% |
[ 2.0% - 2.5% ] 2.21% | 423,396 | 32.3% |
[ 2.5% - 3.0% ] 2.65% | 347,974 | 27.9% |
[ 3.0% - 3.5% ] 3.25% | 125,247 | 26.2% |
[ 3.5% - 4.0% ] 3.72% | 96,103 | 26.5% |
[ 4.0% - 4.5% ] 4.34% | 83,488 | 31.4% |
[ 4.5% - 5.0% ] 4.66% | 44,854 | 31.9% |
[ 5.0% - 5.5% ] 5.21% | 22,126 | 26.3% |
[ 5.5% - 6.0% ] 5.72% | 16,936 | 33.8% |
[ 6.0% - 6.5% ] 6.30% | 3,157 | 45.4% |
[ 6.5% - 7.0% ] 6.78% | 9,803 | 36.3% |
[ 7.0% - 7.5% ] 7.32% | 15,826 | 33.8% |
[ 7.5% - 8.0% ] 7.85% | 21,722 | 34.1% |
[ 8.0% - 8.5% ] 8.38% | 5,952 | 17.6% |
[ 8.5% - 9.0% ] 8.60% | 2,978 | 46.1% |
[ 9.0% - 9.5% ] 9.36% | 41,044 | 28.2% |
[ 9.5% - 10.0% ] 9.91% | 797 | 26.6% |
[ 10.0% - 10.5% ] 10.27% | 14,629 | 31.7% |
[ 10.5% - 11.0% ] 10.64% | 36,586 | 32.0% |
[ 11.0% - 11.5% ] 11.44% | 18,611 | 24.8% |
[ 11.5% - 12.0% ] 11.73% | 2,489 | 25.2% |
[ 12.5% - 13.0% ] 12.71% | 7,367 | 40.7% |
[ 13.0% - 13.5% ] 13.19% | 7,042 | 47.4% |
[ 13.5% - 14.0% ] 13.68% | 2,448 | 43.5% |
[ 14.0% - 14.5% ] 14.35% | 1,115 | 31.9% |
[ 14.5% - 15.0% ] 14.65% | 16,808 | 25.8% |
[ 15.0% - 15.5% ] 15.13% | 1,976 | 29.2% |
[ 15.5% - 16.0% ] 15.63% | 20,633 | 18.7% |
[ 16.5% - 17.0% ] 16.76% | 16,587 | 20.5% |
[ 17.0% - 17.5% ] 17.11% | 2,390 | 10.2% |
[ 18.0% - 18.5% ] 18.08% | 4,309 | 35.8% |
[ 18.5% - 19.0% ] 18.73% | 3,358 | 6.7% |
[ 19.5% - 20.0% ] 19.72% | 3,798 | 22.2% |
[ 20.0% - 20.5% ] 20.20% | 99 | 29.9% |
[ 22.0% - 22.5% ] 22.15% | 158 | 20.3% |
[ 22.5% - 23.0% ] 22.69% | 908 | 62.8% |
[ 23.0% - 23.5% ] 23.39% | 171 | 32.7% |
[ 23.5% - 24.0% ] 23.56% | 3,290 | 24.7% |
[ 24.0% - 24.5% ] 24.03% | 795 | 16.9% |
[ 26.5% - 27.0% ] 26.93% | 3,628 | 25.0% |
[ 27.5% - 28.0% ] 27.92% | 4,499 | 16.0% |
[ 28.0% - 28.5% ] 28.12% | 2,233 | 23.4% |
[ 28.5% - 29.0% ] 28.57% | 119 | 65.8% |
[ 31.0% - 31.5% ] 31.25% | 112 | 63.7% |
[ 31.5% - 32.0% ] 31.50% | 873 | 11.5% |
[ 32.0% - 32.5% ] 32.26% | 248 | 30.6% |
[ 33.0% - 33.5% ] 33.10% | 1,139 | 9.4% |
[ 34.0% - 34.5% ] 34.48% | 406 | 23.3% |
[ 37.0% - 37.5% ] 37.44% | 6,234 | 18.3% |
[ 42.5% - 43.0% ] 42.81% | 1,731 | 21.7% |
[ 43.5% - 44.0% ] 43.65% | 575 | 43.2% |
[ 44.5% - 45.0% ] 44.98% | 3,079 | 4.4% |
[ 45.0% - 45.5% ] 45.03% | 382 | 41.6% |
[ 45.5% - 46.0% ] 45.68% | 1,819 | 15.6% |
[ 46.0% - 46.5% ] 46.30% | 972 | 24.8% |
[ 47.5% - 48.0% ] 47.82% | 1,838 | 25.2% |
[ 48.5% - 49.0% ] 48.84% | 6,540 | 14.4% |
[ 49.0% - 49.5% ] 49.39% | 494 | 50.9% |
[ 51.5% - 52.0% ] 51.53% | 1,011 | 6.3% |
[ 52.5% - 53.0% ] 52.88% | 2,969 | 19.5% |
[ 54.0% - 54.5% ] 54.37% | 607 | 17.6% |
[ 55.5% - 56.0% ] 55.80% | 776 | 30.8% |
[ 57.5% - 58.0% ] 57.97% | 395 | 9.5% |
[ 59.0% - 59.5% ] 59.07% | 237 | 23.2% |
[ 62.5% - 63.0% ] 62.67% | 1,733 | 26.1% |
[ 63.5% - 64.0% ] 63.75% | 1,854 | 22.8% |
[ 65.5% - 66.0% ] 65.71% | 525 | 6.5% |
[ 66.5% - 67.0% ] 66.98% | 733 | 34.9% |
[ 70.5% - 71.0% ] 70.82% | 2,940 | 1.9% |
[ 71.0% - 71.5% ] 71.23% | 146 | 13.8% |
[ 73.5% - 74.0% ] 73.74% | 613 | 31.5% |
[ 74.0% - 74.5% ] 74.43% | 219 | 13.0% |
[ 77.0% - 77.5% ] 77.29% | 1,026 | 7.6% |
[ 77.5% - 78.0% ] 77.56% | 2,117 | 14.0% |
[ 79.5% - 80.0% ] 79.88% | 323 | 4.1% |
[ 81.5% - 82.0% ] 81.78% | 472 | 16.3% |
[ 83.5% - 84.0% ] 83.68% | 190 | 2.5% |
[ 84.0% - 84.5% ] 84.28% | 318 | 13.7% |
[ 87.0% - 87.5% ] 87.40% | 2,071 | 27.7% |
[ 90.0% - 90.5% ] 90.28% | 895 | 52.8% |
[ 91.0% - 91.5% ] 91.13% | 203 | 14.0% |
[ 92.5% - 93.0% ] 92.90% | 7,355 | 9.0% |
[ 94.0% - 94.5% ] 94.16% | 2,960 | 8.4% |
[ 98.5% - 99.0% ] 98.73% | 1,183 | 26.0% |