Hawaiian Wage/Income Gap
COMPARE
Hawaiian
Select to Compare
Wage/Income Gap
Hawaiian Wage/Income Gap
24.9%
WAGE/INCOME GAP
89.3/ 100
METRIC RATING
141st/ 347
METRIC RANK
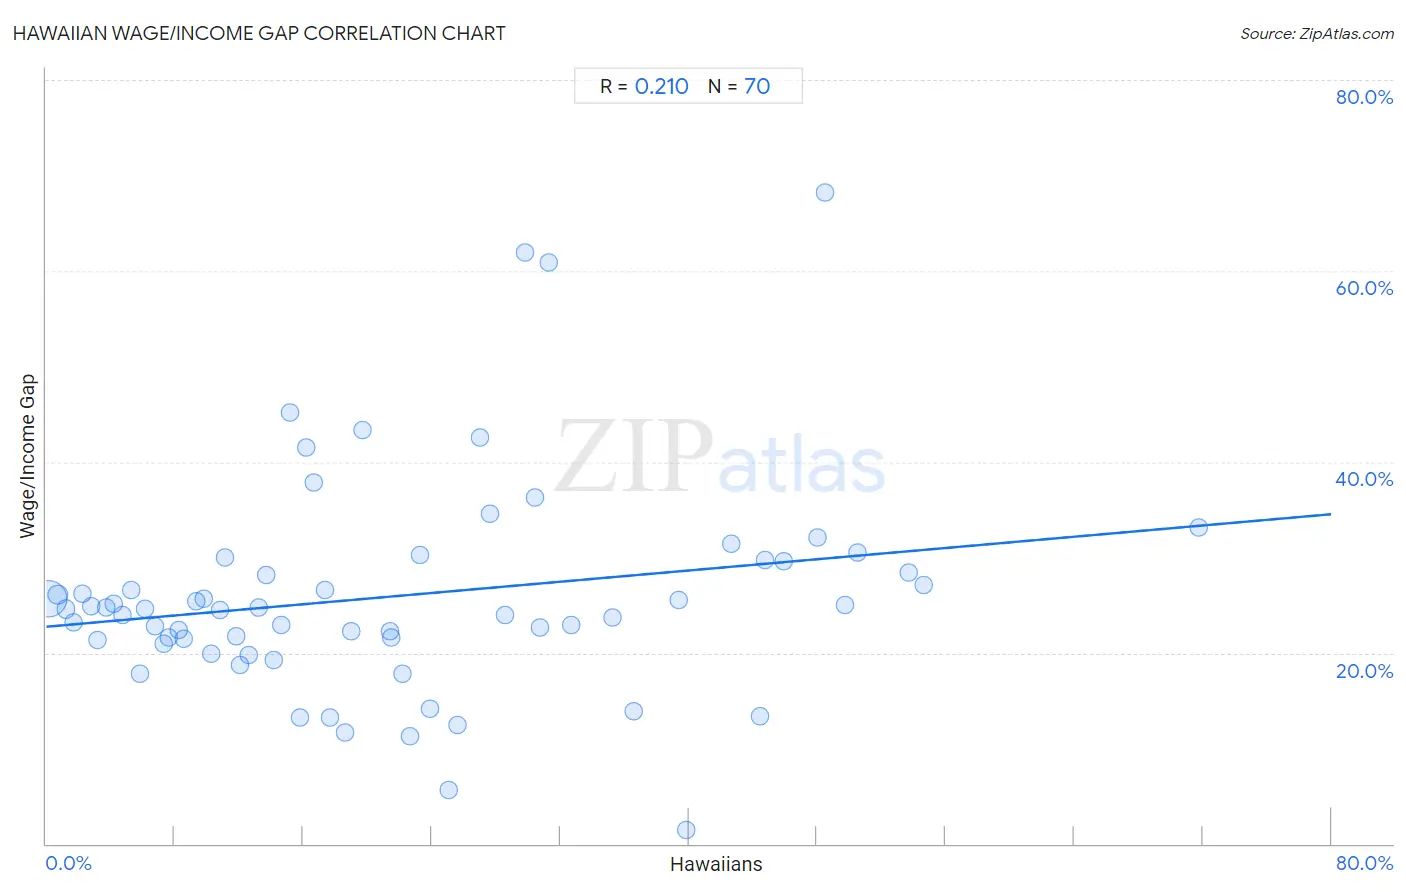
Hawaiian Wage/Income Gap Correlation Chart
The statistical analysis conducted on geographies consisting of 327,384,516 people shows a weak positive correlation between the proportion of Hawaiians and wage/income gap percentage in the United States with a correlation coefficient (R) of 0.210 and weighted average of 24.9%. On average, for every 1% (one percent) increase in Hawaiians within a typical geography, there is an increase of 0.15% in wage/income gap percentage.
It is essential to understand that the correlation between the percentage of Hawaiians and wage/income gap percentage does not imply a direct cause-and-effect relationship. It remains uncertain whether the presence of Hawaiians influences an upward or downward trend in the level of wage/income gap percentage within an area, or if Hawaiians simply ended up residing in those areas with higher or lower levels of wage/income gap percentage due to other factors.
Demographics Similar to Hawaiians by Wage/Income Gap
In terms of wage/income gap, the demographic groups most similar to Hawaiians are Immigrants from Nepal (24.9%, a difference of 0.010%), Hispanic or Latino (24.9%, a difference of 0.040%), Immigrants from Bosnia and Herzegovina (24.8%, a difference of 0.15%), Afghan (24.9%, a difference of 0.20%), and Immigrants from Uganda (24.9%, a difference of 0.22%).
| Demographics | Rating | Rank | Wage/Income Gap |
| Mexican American Indians | 92.2 /100 | #134 | Exceptional 24.7% |
| South American Indians | 92.0 /100 | #135 | Exceptional 24.7% |
| Armenians | 91.3 /100 | #136 | Exceptional 24.8% |
| Immigrants from South Eastern Asia | 90.9 /100 | #137 | Exceptional 24.8% |
| Immigrants from Bosnia and Herzegovina | 90.1 /100 | #138 | Exceptional 24.8% |
| Hispanics or Latinos | 89.5 /100 | #139 | Excellent 24.9% |
| Immigrants from Nepal | 89.3 /100 | #140 | Excellent 24.9% |
| Hawaiians | 89.3 /100 | #141 | Excellent 24.9% |
| Afghans | 88.1 /100 | #142 | Excellent 24.9% |
| Immigrants from Uganda | 88.0 /100 | #143 | Excellent 24.9% |
| Chippewa | 86.9 /100 | #144 | Excellent 25.0% |
| Comanche | 85.2 /100 | #145 | Excellent 25.0% |
| South Americans | 85.2 /100 | #146 | Excellent 25.0% |
| Malaysians | 84.9 /100 | #147 | Excellent 25.0% |
| Iroquois | 83.9 /100 | #148 | Excellent 25.1% |
Hawaiian Wage/Income Gap Correlation Summary
| Measurement | Hawaiian Data | Wage/Income Gap Data |
| Minimum | 0.13% | 1.4% |
| Maximum | 71.7% | 68.2% |
| Range | 71.6% | 66.8% |
| Mean | 21.6% | 25.9% |
| Median | 17.5% | 24.6% |
| Interquartile 25% (IQ1) | 8.5% | 21.4% |
| Interquartile 75% (IQ3) | 30.8% | 29.6% |
| Interquartile Range (IQR) | 22.2% | 8.2% |
| Standard Deviation (Sample) | 16.2% | 11.4% |
| Standard Deviation (Population) | 16.1% | 11.3% |
Correlation Details
| Hawaiian Percentile | Sample Size | Wage/Income Gap |
[ 0.0% - 0.5% ] 0.13% | 278,980,395 | 25.6% |
[ 0.5% - 1.0% ] 0.71% | 27,924,724 | 26.1% |
[ 1.0% - 1.5% ] 1.22% | 8,153,723 | 24.6% |
[ 1.5% - 2.0% ] 1.73% | 4,617,099 | 23.2% |
[ 2.0% - 2.5% ] 2.23% | 1,394,304 | 26.2% |
[ 2.5% - 3.0% ] 2.78% | 1,255,261 | 24.9% |
[ 3.0% - 3.5% ] 3.22% | 881,603 | 21.4% |
[ 3.5% - 4.0% ] 3.73% | 535,189 | 24.8% |
[ 4.0% - 4.5% ] 4.19% | 489,589 | 25.1% |
[ 4.5% - 5.0% ] 4.73% | 352,875 | 23.9% |
[ 5.0% - 5.5% ] 5.27% | 212,583 | 26.5% |
[ 5.5% - 6.0% ] 5.86% | 70,308 | 17.9% |
[ 6.0% - 6.5% ] 6.13% | 111,546 | 24.6% |
[ 6.5% - 7.0% ] 6.78% | 160,123 | 22.8% |
[ 7.0% - 7.5% ] 7.31% | 339,298 | 20.9% |
[ 7.5% - 8.0% ] 7.65% | 124,907 | 21.5% |
[ 8.0% - 8.5% ] 8.24% | 93,972 | 22.4% |
[ 8.5% - 9.0% ] 8.53% | 377,500 | 21.5% |
[ 9.0% - 9.5% ] 9.33% | 133,497 | 25.4% |
[ 9.5% - 10.0% ] 9.77% | 130,838 | 25.7% |
[ 10.0% - 10.5% ] 10.29% | 90,618 | 19.9% |
[ 10.5% - 11.0% ] 10.78% | 179,674 | 24.4% |
[ 11.0% - 11.5% ] 11.15% | 16,192 | 29.9% |
[ 11.5% - 12.0% ] 11.83% | 78,184 | 21.8% |
[ 12.0% - 12.5% ] 12.07% | 65,896 | 18.7% |
[ 12.5% - 13.0% ] 12.64% | 41,868 | 19.8% |
[ 13.0% - 13.5% ] 13.23% | 94,644 | 24.7% |
[ 13.5% - 14.0% ] 13.73% | 25,587 | 28.1% |
[ 14.0% - 14.5% ] 14.14% | 124,786 | 19.2% |
[ 14.5% - 15.0% ] 14.63% | 70,275 | 23.0% |
[ 15.0% - 15.5% ] 15.15% | 3,550 | 45.2% |
[ 15.5% - 16.0% ] 15.77% | 16,439 | 13.2% |
[ 16.0% - 16.5% ] 16.21% | 7,809 | 41.5% |
[ 16.5% - 17.0% ] 16.63% | 6,868 | 37.8% |
[ 17.0% - 17.5% ] 17.34% | 1,528 | 26.6% |
[ 17.5% - 18.0% ] 17.67% | 1,245 | 13.3% |
[ 18.5% - 19.0% ] 18.63% | 7,645 | 11.6% |
[ 19.0% - 19.5% ] 19.00% | 2,489 | 22.3% |
[ 19.5% - 20.0% ] 19.70% | 7,487 | 43.4% |
[ 21.0% - 21.5% ] 21.39% | 2,211 | 22.2% |
[ 21.5% - 22.0% ] 21.52% | 3,221 | 21.6% |
[ 22.0% - 22.5% ] 22.19% | 6,626 | 17.8% |
[ 22.5% - 23.0% ] 22.66% | 11,029 | 11.2% |
[ 23.0% - 23.5% ] 23.27% | 2,742 | 30.3% |
[ 23.5% - 24.0% ] 23.91% | 4,555 | 14.2% |
[ 25.0% - 25.5% ] 25.04% | 1,278 | 5.7% |
[ 25.5% - 26.0% ] 25.61% | 5,267 | 12.5% |
[ 27.0% - 27.5% ] 27.01% | 1,666 | 42.6% |
[ 27.5% - 28.0% ] 27.65% | 8,710 | 34.6% |
[ 28.5% - 29.0% ] 28.59% | 1,462 | 23.9% |
[ 29.5% - 30.0% ] 29.77% | 6,694 | 61.9% |
[ 30.0% - 30.5% ] 30.47% | 2,872 | 36.2% |
[ 30.5% - 31.0% ] 30.76% | 2,971 | 22.6% |
[ 31.0% - 31.5% ] 31.25% | 5,891 | 60.8% |
[ 32.5% - 33.0% ] 32.69% | 10,307 | 22.9% |
[ 35.0% - 35.5% ] 35.24% | 4,827 | 23.7% |
[ 36.5% - 37.0% ] 36.58% | 4,284 | 13.9% |
[ 39.0% - 39.5% ] 39.37% | 10,042 | 25.6% |
[ 39.5% - 40.0% ] 39.87% | 4,475 | 1.4% |
[ 42.5% - 43.0% ] 42.64% | 12,114 | 31.5% |
[ 44.0% - 44.5% ] 44.46% | 902 | 13.4% |
[ 44.5% - 45.0% ] 44.73% | 65,116 | 29.8% |
[ 45.5% - 46.0% ] 45.93% | 3,412 | 29.6% |
[ 47.5% - 48.0% ] 47.99% | 398 | 32.1% |
[ 48.0% - 48.5% ] 48.46% | 130 | 68.2% |
[ 49.5% - 50.0% ] 49.74% | 380 | 25.0% |
[ 50.0% - 50.5% ] 50.47% | 2,853 | 30.4% |
[ 53.5% - 54.0% ] 53.69% | 2,157 | 28.4% |
[ 54.5% - 55.0% ] 54.63% | 12,370 | 27.1% |
[ 71.5% - 72.0% ] 71.73% | 1,436 | 33.1% |