Immigrants from Uruguay Wage/Income Gap

COMPARE

Immigrants from Uruguay
Race
Ancestry
AfghanAfricanAlaska NativeAlaskan AthabascanAlbanianAleutAlsatianAmericanApacheArabArapahoArgentineanArmenianAssyrian/Chaldean/SyriacAustralianAustrianBahamianBangladeshiBarbadianBasqueBelgianBelizeanBermudanBhutaneseBlackfeetBolivianBrazilianBritishBritish West IndianBulgarianBurmeseCajunCambodianCanadianCape VerdeanCarpatho RusynCelticCentral AmericanCentral American IndianCherokeeCheyenneChickasawChileanChineseChippewaChoctawColombianColvilleComancheCosta RicanCreeCreekCroatianCrowCubanCypriotCzechCzechoslovakianDanishDelawareDominicanDutchDutch West IndianEastern EuropeanEcuadorianEgyptianEnglishEstonianEthiopianEuropeanFijianFilipinoFinnishFrenchFrench American IndianFrench CanadianGermanGerman RussianGhanaianGreekGuamanian/ChamorroGuatemalanGuyaneseHaitianHmongHonduranHopiHoumaHungarianIcelanderIndian (Asian)IndonesianInupiatIranianIraqiIrishIroquoisIsraeliItalianJamaicanJapaneseJordanianKenyanKiowaKoreanLaotianLatvianLebaneseLiberianLithuanianLumbeeLuxembourgerMacedonianMalaysianMalteseMarshalleseMenomineeMexicanMexican American IndianMongolianMoroccanNative HawaiianNavajoNepaleseNew ZealanderNicaraguanNigerianNorthern EuropeanNorwegianOkinawanOsageOttawaPaiutePakistaniPalestinianPanamanianParaguayanPennsylvania GermanPeruvianPimaPolishPortuguesePotawatomiPuebloPuerto RicanPuget Sound SalishRomanianRussianSalvadoranSamoanScandinavianScotch-IrishScottishSeminoleSenegaleseSerbianShoshoneSierra LeoneanSiouxSlavicSlovakSloveneSomaliSouth AfricanSouth AmericanSouth American IndianSoviet UnionSpaniardSpanishSpanish AmericanSpanish American IndianSri LankanSubsaharan AfricanSudaneseSwedishSwissSyrianTaiwaneseThaiTlingit-HaidaTohono O'OdhamTonganTrinidadian and TobagonianTsimshianTurkishU.S. Virgin IslanderUgandanUkrainianUruguayanUteVenezuelanVietnameseWelshWest IndianYakamaYaquiYugoslavianYumanYup'ikZimbabwean
Immigration
NonimmigrantsImmigrantsAfghanistanAfricaAlbaniaArgentinaArmeniaAsiaAustraliaAustriaBahamasBangladeshBarbadosBelarusBelgiumBelizeBoliviaBosnia and HerzegovinaBrazilBulgariaBurma/MyanmarCabo VerdeCambodiaCameroonCanadaCaribbeanCentral AmericaChileChinaColombiaCongoCosta RicaCroatiaCubaCzechoslovakiaDenmarkDominicaDominican RepublicEastern AfricaEastern AsiaEastern EuropeEcuadorEgyptEl SalvadorEnglandEritreaEthiopiaEuropeFijiFranceGermanyGhanaGreeceGrenadaGuatemalaGuyanaHaitiHondurasHong KongHungaryIndiaIndonesiaIranIraqIrelandIsraelItalyJamaicaJapanJordanKazakhstanKenyaKoreaKuwaitLaosLatin AmericaLatviaLebanonLiberiaLithuaniaMalaysiaMexicoMicronesiaMiddle AfricaMoldovaMoroccoNepalNetherlandsNicaraguaNigeriaNorth AmericaNorth MacedoniaNorthern AfricaNorthern EuropeNorwayOceaniaPakistanPanamaPeruPhilippinesPolandPortugalRomaniaRussiaSaudi ArabiaScotlandSenegalSerbiaSierra LeoneSingaporeSomaliaSouth AfricaSouth AmericaSouth Central AsiaSouth Eastern AsiaSouthern EuropeSpainSri LankaSt. Vincent and the GrenadinesSudanSwedenSwitzerlandSyriaTaiwanThailandTrinidad and TobagoTurkeyUgandaUkraineUruguayUzbekistanVenezuelaVietnamWest IndiesWestern AfricaWestern AsiaWestern EuropeYemenZaireZimbabweAzores
Select to Compare
Race
Ancestry
AfghanAfricanAlaska NativeAlaskan AthabascanAlbanianAleutAlsatianAmericanApacheArabArapahoArgentineanArmenianAssyrian/Chaldean/SyriacAustralianAustrianBahamianBangladeshiBarbadianBasqueBelgianBelizeanBermudanBhutaneseBlackfeetBolivianBrazilianBritishBritish West IndianBulgarianBurmeseCajunCambodianCanadianCape VerdeanCarpatho RusynCelticCentral AmericanCentral American IndianCherokeeCheyenneChickasawChileanChineseChippewaChoctawColombianColvilleComancheCosta RicanCreeCreekCroatianCrowCubanCypriotCzechCzechoslovakianDanishDelawareDominicanDutchDutch West IndianEastern EuropeanEcuadorianEgyptianEnglishEstonianEthiopianEuropeanFijianFilipinoFinnishFrenchFrench American IndianFrench CanadianGermanGerman RussianGhanaianGreekGuamanian/ChamorroGuatemalanGuyaneseHaitianHmongHonduranHopiHoumaHungarianIcelanderIndian (Asian)IndonesianInupiatIranianIraqiIrishIroquoisIsraeliItalianJamaicanJapaneseJordanianKenyanKiowaKoreanLaotianLatvianLebaneseLiberianLithuanianLumbeeLuxembourgerMacedonianMalaysianMalteseMarshalleseMenomineeMexicanMexican American IndianMongolianMoroccanNative HawaiianNavajoNepaleseNew ZealanderNicaraguanNigerianNorthern EuropeanNorwegianOkinawanOsageOttawaPaiutePakistaniPalestinianPanamanianParaguayanPennsylvania GermanPeruvianPimaPolishPortuguesePotawatomiPuebloPuerto RicanPuget Sound SalishRomanianRussianSalvadoranSamoanScandinavianScotch-IrishScottishSeminoleSenegaleseSerbianShoshoneSierra LeoneanSiouxSlavicSlovakSloveneSomaliSouth AfricanSouth AmericanSouth American IndianSoviet UnionSpaniardSpanishSpanish AmericanSpanish American IndianSri LankanSubsaharan AfricanSudaneseSwedishSwissSyrianTaiwaneseThaiTlingit-HaidaTohono O'OdhamTonganTrinidadian and TobagonianTsimshianTurkishU.S. Virgin IslanderUgandanUkrainianUruguayanUteVenezuelanVietnameseWelshWest IndianYakamaYaquiYugoslavianYumanYup'ikZimbabwean
Immigration
NonimmigrantsImmigrantsAfghanistanAfricaAlbaniaArgentinaArmeniaAsiaAustraliaAustriaBahamasBangladeshBarbadosBelarusBelgiumBelizeBoliviaBosnia and HerzegovinaBrazilBulgariaBurma/MyanmarCabo VerdeCambodiaCameroonCanadaCaribbeanCentral AmericaChileChinaColombiaCongoCosta RicaCroatiaCubaCzechoslovakiaDenmarkDominicaDominican RepublicEastern AfricaEastern AsiaEastern EuropeEcuadorEgyptEl SalvadorEnglandEritreaEthiopiaEuropeFijiFranceGermanyGhanaGreeceGrenadaGuatemalaGuyanaHaitiHondurasHong KongHungaryIndiaIndonesiaIranIraqIrelandIsraelItalyJamaicaJapanJordanKazakhstanKenyaKoreaKuwaitLaosLatin AmericaLatviaLebanonLiberiaLithuaniaMalaysiaMexicoMicronesiaMiddle AfricaMoldovaMoroccoNepalNetherlandsNicaraguaNigeriaNorth AmericaNorth MacedoniaNorthern AfricaNorthern EuropeNorwayOceaniaPakistanPanamaPeruPhilippinesPolandPortugalRomaniaRussiaSaudi ArabiaScotlandSenegalSerbiaSierra LeoneSingaporeSomaliaSouth AfricaSouth AmericaSouth Central AsiaSouth Eastern AsiaSouthern EuropeSpainSri LankaSt. Vincent and the GrenadinesSudanSwedenSwitzerlandSyriaTaiwanThailandTrinidad and TobagoTurkeyUgandaUkraineUzbekistanVenezuelaVietnamWest IndiesWestern AfricaWestern AsiaWestern EuropeYemenZaireZimbabweAzores
Wage/Income Gap
Income
Poverty
Unemployment
Labor Participation
Family Structure
Vehicle Availability
Education Level
Disability

Immigrants from Uruguay Wage/Income Gap
Exceptional

24.6%
WAGE/INCOME GAP
93.8/ 100
METRIC RATING
126th/ 347
METRIC RANK

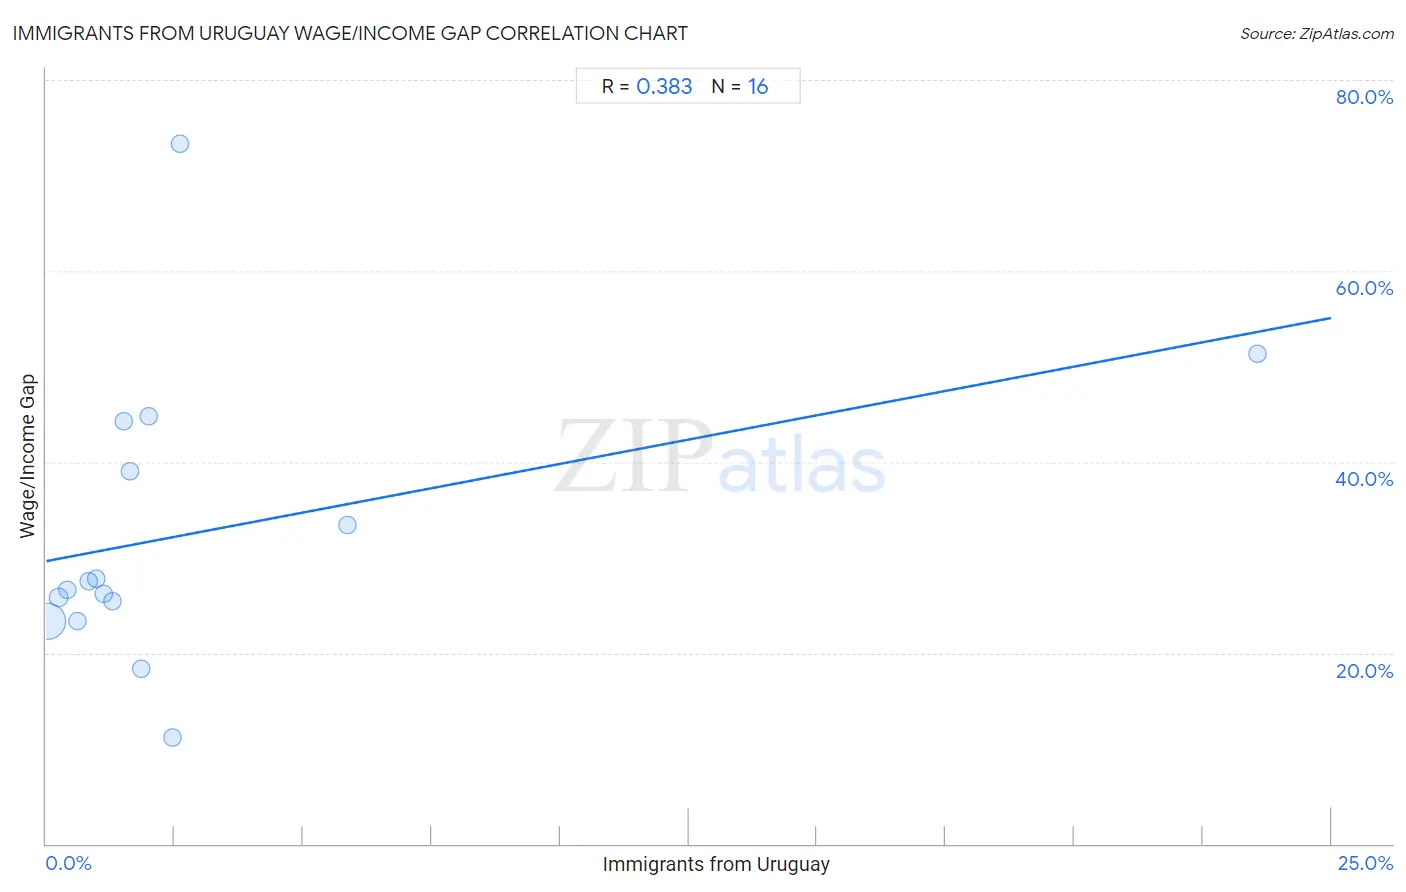
Immigrants from Uruguay Wage/Income Gap Correlation Chart

The statistical analysis conducted on geographies consisting of 133,243,894 people shows a mild positive correlation between the proportion of Immigrants from Uruguay and wage/income gap percentage in the United States with a correlation coefficient (R) of 0.383 and weighted average of 24.6%. On average, for every 1% (one percent) increase in Immigrants from Uruguay within a typical geography, there is an increase of 1.0% in wage/income gap percentage.
Immigrants from Uruguay Wage/Income Gap
It is essential to understand that the correlation between the percentage of Immigrants from Uruguay and wage/income gap percentage does not imply a direct cause-and-effect relationship. It remains uncertain whether the presence of Immigrants from Uruguay influences an upward or downward trend in the level of wage/income gap percentage within an area, or if Immigrants from Uruguay simply ended up residing in those areas with higher or lower levels of wage/income gap percentage due to other factors.

Demographics Similar to Immigrants from Uruguay by Wage/Income Gap

In terms of wage/income gap, the demographic groups most similar to Immigrants from Uruguay are German Russian (24.6%, a difference of 0.010%), Spanish American (24.6%, a difference of 0.020%), Immigrants from South America (24.6%, a difference of 0.040%), Immigrants from Central America (24.6%, a difference of 0.070%), and Yup'ik (24.7%, a difference of 0.13%).
DemographicsRating | RankWage/Income Gap
Kenyans
95.8
/100
|
#119
Exceptional
24.5%
Cree
95.6
/100
|
#120
Exceptional
24.5%
Immigrants from Thailand
94.9
/100
|
#121
Exceptional
24.5%
Apache
94.8
/100
|
#122
Exceptional
24.5%
Natives/Alaskans
94.6
/100
|
#123
Exceptional
24.6%
Immigrants from South America
93.9
/100
|
#124
Exceptional
24.6%
Spanish Americans
93.8
/100
|
#125
Exceptional
24.6%
Immigrants from Uruguay
93.8
/100
|
#126
Exceptional
24.6%
German Russians
93.7
/100
|
#127
Exceptional
24.6%
Immigrants from Central America
93.5
/100
|
#128
Exceptional
24.6%
Yup'ik
93.3
/100
|
#129
Exceptional
24.7%
Alsatians
93.2
/100
|
#130
Exceptional
24.7%
Immigrants from Philippines
93.0
/100
|
#131
Exceptional
24.7%
Immigrants from Costa Rica
92.4
/100
|
#132
Exceptional
24.7%
Colombians
92.4
/100
|
#133
Exceptional
24.7%

Immigrants from Uruguay Wage/Income Gap Correlation Summary

MeasurementImmigrants from Uruguay DataWage/Income Gap Data
Minimum0.035%11.1%
Maximum23.6%73.3%
Range23.5%62.2%
Mean2.9%32.6%
Median1.4%27.1%
Interquartile 25% (IQ1)0.71%24.3%
Interquartile 75% (IQ3)2.2%41.7%
Interquartile Range (IQR)1.5%17.3%
Standard Deviation (Sample)5.7%15.1%
Standard Deviation (Population)5.5%14.6%

Correlation Details

Immigrants from Uruguay PercentileSample SizeWage/Income Gap
[
0.0%
-
0.5%
]
0.035%
119,954,09823.3%
[
0.0%
-
0.5%
]
0.24%
8,950,16225.8%
[
0.0%
-
0.5%
]
0.41%
2,019,86026.6%
[
0.5%
-
1.0%
]
0.61%
1,016,84823.3%
[
0.5%
-
1.0%
]
0.82%
586,07027.5%
[
0.5%
-
1.0%
]
0.98%
195,40327.8%
[
1.0%
-
1.5%
]
1.13%
208,28726.2%
[
1.0%
-
1.5%
]
1.30%
124,46125.4%
[
1.5%
-
2.0%
]
1.52%
28,13744.3%
[
1.5%
-
2.0%
]
1.63%
3,86839.0%
[
1.5%
-
2.0%
]
1.84%
143,16418.3%
[
1.5%
-
2.0%
]
1.99%
6,44044.8%
[
2.0%
-
2.5%
]
2.46%
3,86411.1%
[
2.5%
-
3.0%
]
2.60%
1,84973.3%
[
5.5%
-
6.0%
]
5.87%
1,19233.4%
[
23.5%
-
24.0%
]
23.56%
19151.4%