Immigrants from Portugal Wage/Income Gap
COMPARE
Immigrants from Portugal
Select to Compare
Wage/Income Gap
Immigrants from Portugal Wage/Income Gap
26.7%
WAGE/INCOME GAP
9.5/ 100
METRIC RATING
216th/ 347
METRIC RANK
Immigrants from Portugal Wage/Income Gap Correlation Chart
The statistical analysis conducted on geographies consisting of 174,735,300 people shows no correlation between the proportion of Immigrants from Portugal and wage/income gap percentage in the United States with a correlation coefficient (R) of 0.038 and weighted average of 26.7%. On average, for every 1% (one percent) increase in Immigrants from Portugal within a typical geography, there is an increase of 0.084% in wage/income gap percentage.
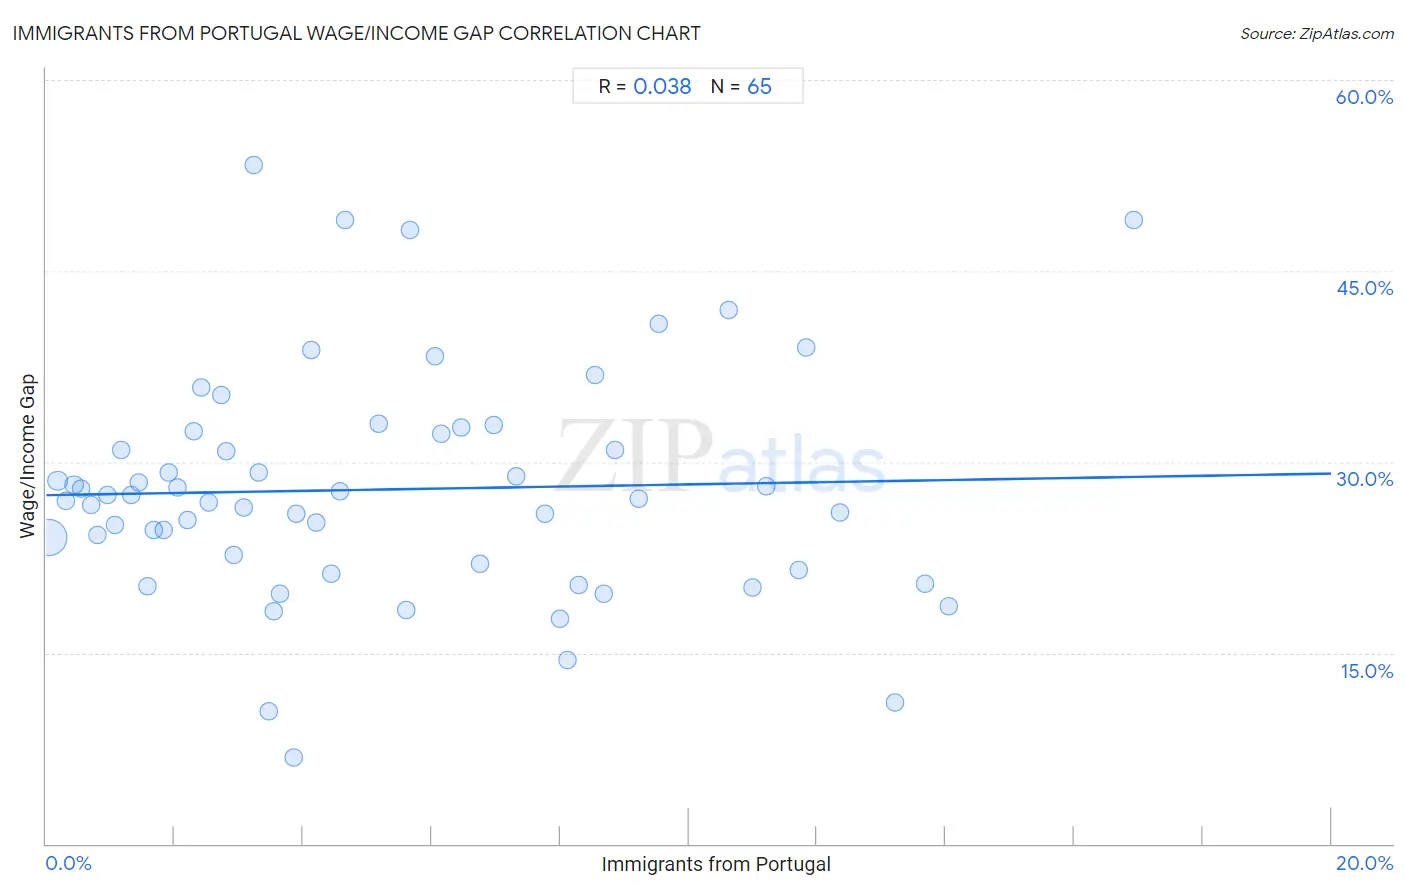
It is essential to understand that the correlation between the percentage of Immigrants from Portugal and wage/income gap percentage does not imply a direct cause-and-effect relationship. It remains uncertain whether the presence of Immigrants from Portugal influences an upward or downward trend in the level of wage/income gap percentage within an area, or if Immigrants from Portugal simply ended up residing in those areas with higher or lower levels of wage/income gap percentage due to other factors.
Demographics Similar to Immigrants from Portugal by Wage/Income Gap
In terms of wage/income gap, the demographic groups most similar to Immigrants from Portugal are Yugoslavian (26.7%, a difference of 0.040%), Brazilian (26.7%, a difference of 0.050%), Immigrants from Saudi Arabia (26.7%, a difference of 0.080%), Immigrants from Poland (26.7%, a difference of 0.11%), and Immigrants from Latvia (26.7%, a difference of 0.12%).
| Demographics | Rating | Rank | Wage/Income Gap |
| Immigrants from Kuwait | 12.6 /100 | #209 | Poor 26.6% |
| Arabs | 12.3 /100 | #210 | Poor 26.6% |
| Mongolians | 11.4 /100 | #211 | Poor 26.6% |
| Iraqis | 11.2 /100 | #212 | Poor 26.6% |
| Immigrants from Iraq | 10.3 /100 | #213 | Poor 26.7% |
| Immigrants from China | 10.3 /100 | #214 | Poor 26.7% |
| Yugoslavians | 9.7 /100 | #215 | Tragic 26.7% |
| Immigrants from Portugal | 9.5 /100 | #216 | Tragic 26.7% |
| Brazilians | 9.2 /100 | #217 | Tragic 26.7% |
| Immigrants from Saudi Arabia | 9.1 /100 | #218 | Tragic 26.7% |
| Immigrants from Poland | 8.9 /100 | #219 | Tragic 26.7% |
| Immigrants from Latvia | 8.9 /100 | #220 | Tragic 26.7% |
| Immigrants from Spain | 8.5 /100 | #221 | Tragic 26.8% |
| Bolivians | 8.3 /100 | #222 | Tragic 26.8% |
| Jordanians | 8.0 /100 | #223 | Tragic 26.8% |
Immigrants from Portugal Wage/Income Gap Correlation Summary
| Measurement | Immigrants from Portugal Data | Wage/Income Gap Data |
| Minimum | 0.034% | 6.7% |
| Maximum | 16.9% | 53.3% |
| Range | 16.9% | 46.6% |
| Mean | 5.3% | 27.8% |
| Median | 4.1% | 27.1% |
| Interquartile 25% (IQ1) | 2.0% | 21.7% |
| Interquartile 75% (IQ3) | 8.2% | 32.3% |
| Interquartile Range (IQR) | 6.2% | 10.6% |
| Standard Deviation (Sample) | 4.1% | 9.0% |
| Standard Deviation (Population) | 4.1% | 9.0% |
Correlation Details
| Immigrants from Portugal Percentile | Sample Size | Wage/Income Gap |
[ 0.0% - 0.5% ] 0.034% | 139,023,742 | 24.1% |
[ 0.0% - 0.5% ] 0.18% | 16,735,243 | 28.5% |
[ 0.0% - 0.5% ] 0.30% | 5,402,518 | 26.9% |
[ 0.0% - 0.5% ] 0.43% | 3,125,884 | 28.2% |
[ 0.5% - 1.0% ] 0.55% | 2,573,954 | 27.9% |
[ 0.5% - 1.0% ] 0.69% | 1,311,029 | 26.6% |
[ 0.5% - 1.0% ] 0.81% | 647,379 | 24.3% |
[ 0.5% - 1.0% ] 0.95% | 669,207 | 27.4% |
[ 1.0% - 1.5% ] 1.06% | 687,867 | 25.0% |
[ 1.0% - 1.5% ] 1.17% | 306,117 | 30.9% |
[ 1.0% - 1.5% ] 1.33% | 475,318 | 27.4% |
[ 1.0% - 1.5% ] 1.45% | 319,155 | 28.4% |
[ 1.5% - 2.0% ] 1.58% | 197,755 | 20.2% |
[ 1.5% - 2.0% ] 1.68% | 221,280 | 24.6% |
[ 1.5% - 2.0% ] 1.82% | 362,744 | 24.7% |
[ 1.5% - 2.0% ] 1.91% | 104,757 | 29.1% |
[ 2.0% - 2.5% ] 2.05% | 341,530 | 28.0% |
[ 2.0% - 2.5% ] 2.20% | 215,673 | 25.4% |
[ 2.0% - 2.5% ] 2.29% | 26,676 | 32.4% |
[ 2.0% - 2.5% ] 2.41% | 120,839 | 35.8% |
[ 2.5% - 3.0% ] 2.53% | 163,270 | 26.8% |
[ 2.5% - 3.0% ] 2.72% | 29,450 | 35.2% |
[ 2.5% - 3.0% ] 2.80% | 184,081 | 30.8% |
[ 2.5% - 3.0% ] 2.92% | 103,810 | 22.6% |
[ 3.0% - 3.5% ] 3.07% | 83,553 | 26.4% |
[ 3.0% - 3.5% ] 3.23% | 13,154 | 53.3% |
[ 3.0% - 3.5% ] 3.31% | 77,411 | 29.2% |
[ 3.0% - 3.5% ] 3.46% | 37,993 | 10.4% |
[ 3.5% - 4.0% ] 3.54% | 90,831 | 18.3% |
[ 3.5% - 4.0% ] 3.64% | 15,496 | 19.6% |
[ 3.5% - 4.0% ] 3.84% | 18,624 | 6.7% |
[ 3.5% - 4.0% ] 3.89% | 19,747 | 25.9% |
[ 4.0% - 4.5% ] 4.12% | 43,579 | 38.8% |
[ 4.0% - 4.5% ] 4.20% | 32,800 | 25.3% |
[ 4.0% - 4.5% ] 4.44% | 64,636 | 21.2% |
[ 4.5% - 5.0% ] 4.58% | 111,351 | 27.7% |
[ 4.5% - 5.0% ] 4.64% | 3,620 | 49.0% |
[ 5.0% - 5.5% ] 5.17% | 82,314 | 33.0% |
[ 5.5% - 6.0% ] 5.61% | 196 | 18.3% |
[ 5.5% - 6.0% ] 5.67% | 2,436 | 48.2% |
[ 6.0% - 6.5% ] 6.05% | 215 | 38.3% |
[ 6.0% - 6.5% ] 6.16% | 86,201 | 32.2% |
[ 6.0% - 6.5% ] 6.45% | 10,466 | 32.7% |
[ 6.5% - 7.0% ] 6.74% | 11,966 | 22.0% |
[ 6.5% - 7.0% ] 6.96% | 4,556 | 32.9% |
[ 7.0% - 7.5% ] 7.31% | 12,072 | 28.8% |
[ 7.5% - 8.0% ] 7.76% | 100,787 | 25.9% |
[ 7.5% - 8.0% ] 8.00% | 21,383 | 17.6% |
[ 8.0% - 8.5% ] 8.11% | 47,012 | 14.4% |
[ 8.0% - 8.5% ] 8.29% | 16,286 | 20.3% |
[ 8.5% - 9.0% ] 8.54% | 56,696 | 36.9% |
[ 8.5% - 9.0% ] 8.68% | 27,162 | 19.7% |
[ 8.5% - 9.0% ] 8.86% | 27,548 | 31.0% |
[ 9.0% - 9.5% ] 9.22% | 25,084 | 27.1% |
[ 9.5% - 10.0% ] 9.53% | 18,445 | 40.8% |
[ 10.5% - 11.0% ] 10.61% | 12,465 | 41.9% |
[ 10.5% - 11.0% ] 11.00% | 30,558 | 20.1% |
[ 11.0% - 11.5% ] 11.21% | 93,638 | 28.1% |
[ 11.5% - 12.0% ] 11.71% | 8,763 | 21.5% |
[ 11.5% - 12.0% ] 11.82% | 17,164 | 39.0% |
[ 12.0% - 12.5% ] 12.36% | 26,807 | 26.0% |
[ 13.0% - 13.5% ] 13.22% | 21,742 | 11.1% |
[ 13.5% - 14.0% ] 13.68% | 6,484 | 20.4% |
[ 14.0% - 14.5% ] 14.05% | 121 | 18.7% |
[ 16.5% - 17.0% ] 16.93% | 4,660 | 49.0% |