Immigrants from Pakistan Wage/Income Gap
COMPARE
Immigrants from Pakistan
Select to Compare
Wage/Income Gap
Immigrants from Pakistan Wage/Income Gap
27.0%
WAGE/INCOME GAP
4.9/ 100
METRIC RATING
234th/ 347
METRIC RANK
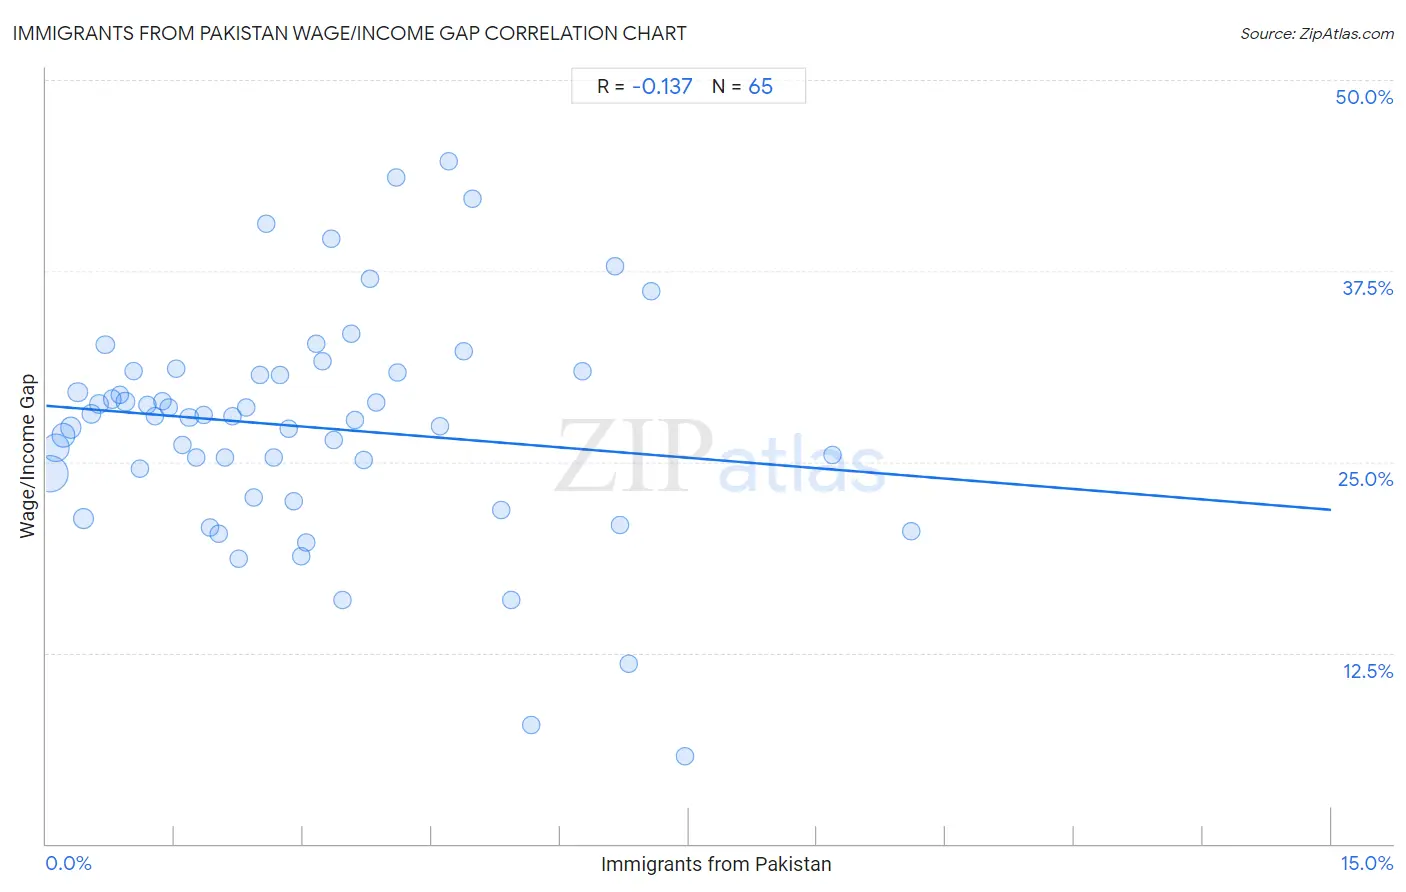
Immigrants from Pakistan Wage/Income Gap Correlation Chart
The statistical analysis conducted on geographies consisting of 283,872,842 people shows a poor negative correlation between the proportion of Immigrants from Pakistan and wage/income gap percentage in the United States with a correlation coefficient (R) of -0.137 and weighted average of 27.0%. On average, for every 1% (one percent) increase in Immigrants from Pakistan within a typical geography, there is a decrease of 0.45% in wage/income gap percentage.
It is essential to understand that the correlation between the percentage of Immigrants from Pakistan and wage/income gap percentage does not imply a direct cause-and-effect relationship. It remains uncertain whether the presence of Immigrants from Pakistan influences an upward or downward trend in the level of wage/income gap percentage within an area, or if Immigrants from Pakistan simply ended up residing in those areas with higher or lower levels of wage/income gap percentage due to other factors.
Demographics Similar to Immigrants from Pakistan by Wage/Income Gap
In terms of wage/income gap, the demographic groups most similar to Immigrants from Pakistan are Immigrants from Hungary (27.0%, a difference of 0.010%), Immigrants from Romania (27.0%, a difference of 0.030%), Immigrants from Brazil (27.0%, a difference of 0.050%), Argentinean (27.0%, a difference of 0.11%), and Bhutanese (27.0%, a difference of 0.13%).
| Demographics | Rating | Rank | Wage/Income Gap |
| Spaniards | 5.6 /100 | #227 | Tragic 27.0% |
| Immigrants from Turkey | 5.6 /100 | #228 | Tragic 27.0% |
| Immigrants from Asia | 5.5 /100 | #229 | Tragic 27.0% |
| Ottawa | 5.3 /100 | #230 | Tragic 27.0% |
| Bhutanese | 5.3 /100 | #231 | Tragic 27.0% |
| Argentineans | 5.2 /100 | #232 | Tragic 27.0% |
| Immigrants from Brazil | 5.0 /100 | #233 | Tragic 27.0% |
| Immigrants from Pakistan | 4.9 /100 | #234 | Tragic 27.0% |
| Immigrants from Hungary | 4.8 /100 | #235 | Tragic 27.0% |
| Immigrants from Romania | 4.8 /100 | #236 | Tragic 27.0% |
| Immigrants from Eastern Asia | 4.4 /100 | #237 | Tragic 27.1% |
| Osage | 4.4 /100 | #238 | Tragic 27.1% |
| Estonians | 4.3 /100 | #239 | Tragic 27.1% |
| Immigrants from Europe | 3.8 /100 | #240 | Tragic 27.1% |
| Creek | 3.8 /100 | #241 | Tragic 27.1% |
Immigrants from Pakistan Wage/Income Gap Correlation Summary
| Measurement | Immigrants from Pakistan Data | Wage/Income Gap Data |
| Minimum | 0.041% | 5.7% |
| Maximum | 10.1% | 44.7% |
| Range | 10.1% | 39.0% |
| Mean | 3.0% | 27.3% |
| Median | 2.7% | 28.0% |
| Interquartile 25% (IQ1) | 1.3% | 23.5% |
| Interquartile 75% (IQ3) | 4.1% | 30.9% |
| Interquartile Range (IQR) | 2.8% | 7.4% |
| Standard Deviation (Sample) | 2.2% | 7.4% |
| Standard Deviation (Population) | 2.2% | 7.4% |
Correlation Details
| Immigrants from Pakistan Percentile | Sample Size | Wage/Income Gap |
[ 0.0% - 0.5% ] 0.041% | 111,882,577 | 24.3% |
[ 0.0% - 0.5% ] 0.12% | 56,137,498 | 25.9% |
[ 0.0% - 0.5% ] 0.20% | 33,846,106 | 26.7% |
[ 0.0% - 0.5% ] 0.29% | 19,884,445 | 27.2% |
[ 0.0% - 0.5% ] 0.37% | 11,371,022 | 29.6% |
[ 0.0% - 0.5% ] 0.44% | 17,253,186 | 21.3% |
[ 0.5% - 1.0% ] 0.53% | 5,846,929 | 28.1% |
[ 0.5% - 1.0% ] 0.61% | 4,267,718 | 28.8% |
[ 0.5% - 1.0% ] 0.69% | 3,424,482 | 32.7% |
[ 0.5% - 1.0% ] 0.77% | 2,835,147 | 29.1% |
[ 0.5% - 1.0% ] 0.86% | 2,142,977 | 29.4% |
[ 0.5% - 1.0% ] 0.92% | 3,030,637 | 28.9% |
[ 1.0% - 1.5% ] 1.02% | 1,738,290 | 30.9% |
[ 1.0% - 1.5% ] 1.10% | 839,576 | 24.6% |
[ 1.0% - 1.5% ] 1.19% | 984,346 | 28.8% |
[ 1.0% - 1.5% ] 1.26% | 1,342,300 | 28.0% |
[ 1.0% - 1.5% ] 1.35% | 676,245 | 29.0% |
[ 1.0% - 1.5% ] 1.43% | 517,882 | 28.6% |
[ 1.5% - 2.0% ] 1.51% | 656,256 | 31.1% |
[ 1.5% - 2.0% ] 1.59% | 473,446 | 26.1% |
[ 1.5% - 2.0% ] 1.67% | 505,976 | 27.9% |
[ 1.5% - 2.0% ] 1.76% | 242,728 | 25.3% |
[ 1.5% - 2.0% ] 1.83% | 413,327 | 28.1% |
[ 1.5% - 2.0% ] 1.91% | 195,240 | 20.7% |
[ 2.0% - 2.5% ] 2.01% | 123,228 | 20.3% |
[ 2.0% - 2.5% ] 2.09% | 157,869 | 25.3% |
[ 2.0% - 2.5% ] 2.17% | 386,225 | 28.0% |
[ 2.0% - 2.5% ] 2.24% | 363,055 | 18.6% |
[ 2.0% - 2.5% ] 2.33% | 135,957 | 28.5% |
[ 2.0% - 2.5% ] 2.42% | 206,771 | 22.7% |
[ 2.0% - 2.5% ] 2.50% | 254,522 | 30.7% |
[ 2.5% - 3.0% ] 2.57% | 73,701 | 40.6% |
[ 2.5% - 3.0% ] 2.66% | 76,816 | 25.3% |
[ 2.5% - 3.0% ] 2.72% | 99,561 | 30.7% |
[ 2.5% - 3.0% ] 2.83% | 99,677 | 27.2% |
[ 2.5% - 3.0% ] 2.89% | 178,062 | 22.5% |
[ 2.5% - 3.0% ] 2.97% | 38,862 | 18.8% |
[ 3.0% - 3.5% ] 3.04% | 129,420 | 19.7% |
[ 3.0% - 3.5% ] 3.16% | 67,044 | 32.7% |
[ 3.0% - 3.5% ] 3.23% | 32,104 | 31.6% |
[ 3.0% - 3.5% ] 3.32% | 36,559 | 39.6% |
[ 3.0% - 3.5% ] 3.36% | 134,107 | 26.4% |
[ 3.0% - 3.5% ] 3.46% | 109,978 | 15.9% |
[ 3.5% - 4.0% ] 3.56% | 18,357 | 33.4% |
[ 3.5% - 4.0% ] 3.61% | 63,183 | 27.8% |
[ 3.5% - 4.0% ] 3.70% | 86,002 | 25.1% |
[ 3.5% - 4.0% ] 3.78% | 123,078 | 37.0% |
[ 3.5% - 4.0% ] 3.85% | 9,567 | 28.9% |
[ 4.0% - 4.5% ] 4.08% | 4,265 | 43.6% |
[ 4.0% - 4.5% ] 4.10% | 31,609 | 30.8% |
[ 4.5% - 5.0% ] 4.60% | 50,245 | 27.3% |
[ 4.5% - 5.0% ] 4.70% | 12,209 | 44.7% |
[ 4.5% - 5.0% ] 4.88% | 17,793 | 32.3% |
[ 4.5% - 5.0% ] 4.97% | 95,920 | 42.2% |
[ 5.0% - 5.5% ] 5.32% | 30,553 | 21.8% |
[ 5.0% - 5.5% ] 5.43% | 13,010 | 16.0% |
[ 5.5% - 6.0% ] 5.66% | 10,990 | 7.7% |
[ 6.0% - 6.5% ] 6.26% | 1,502 | 30.9% |
[ 6.5% - 7.0% ] 6.64% | 76,600 | 37.8% |
[ 6.5% - 7.0% ] 6.70% | 1,374 | 20.9% |
[ 6.5% - 7.0% ] 6.80% | 3,296 | 11.8% |
[ 7.0% - 7.5% ] 7.07% | 2,533 | 36.2% |
[ 7.0% - 7.5% ] 7.46% | 3,002 | 5.7% |
[ 9.0% - 9.5% ] 9.18% | 2,135 | 25.4% |
[ 10.0% - 10.5% ] 10.09% | 3,765 | 20.4% |