Immigrants from Central America Wage/Income Gap
COMPARE
Immigrants from Central America
Select to Compare
Wage/Income Gap
Immigrants from Central America Wage/Income Gap
24.6%
WAGE/INCOME GAP
93.5/ 100
METRIC RATING
128th/ 347
METRIC RANK
Immigrants from Central America Wage/Income Gap Correlation Chart
The statistical analysis conducted on geographies consisting of 534,855,009 people shows a mild positive correlation between the proportion of Immigrants from Central America and wage/income gap percentage in the United States with a correlation coefficient (R) of 0.354 and weighted average of 24.6%. On average, for every 1% (one percent) increase in Immigrants from Central America within a typical geography, there is an increase of 0.12% in wage/income gap percentage.
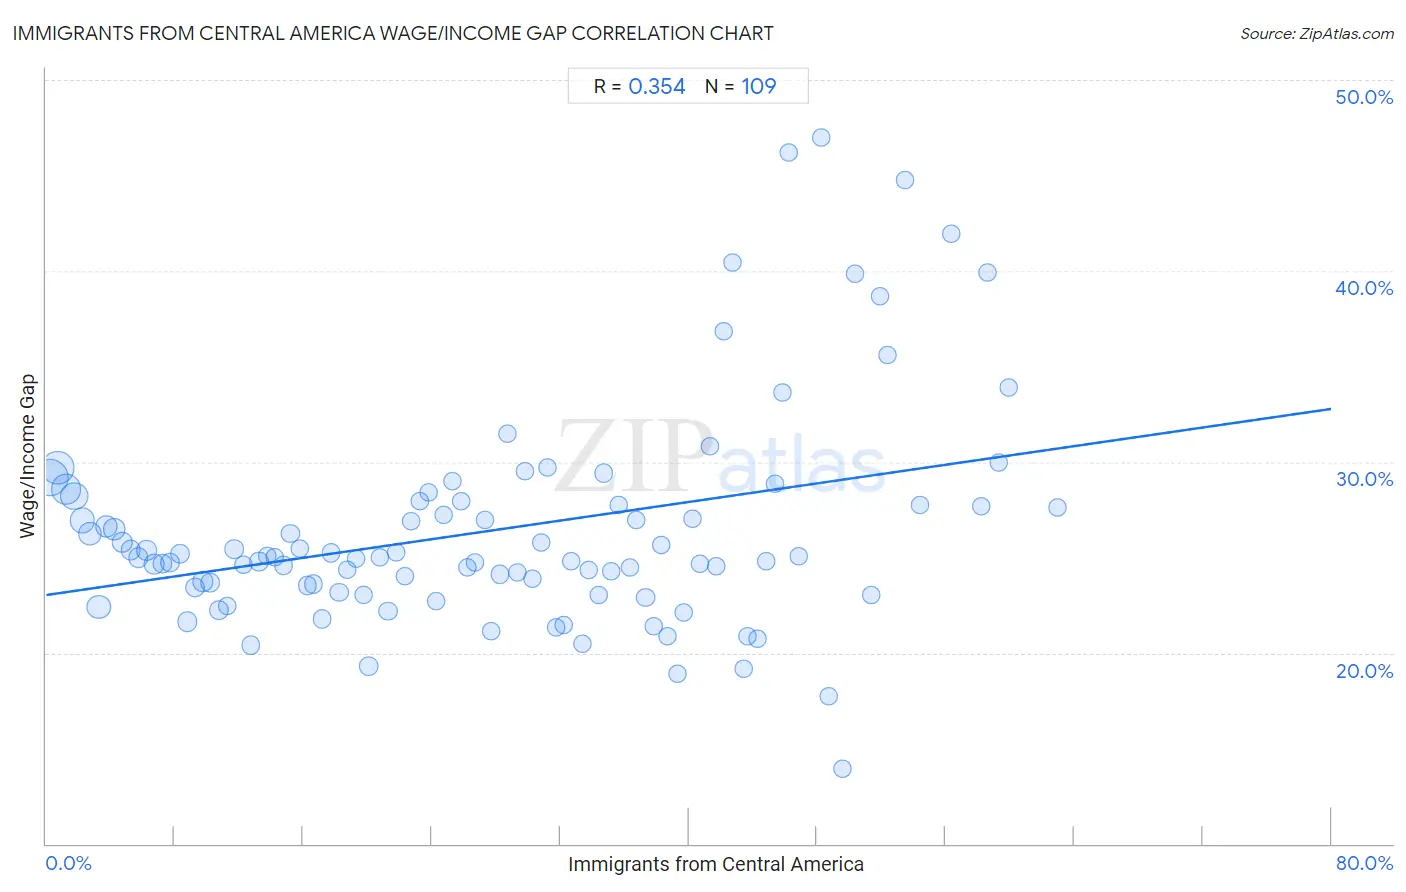
It is essential to understand that the correlation between the percentage of Immigrants from Central America and wage/income gap percentage does not imply a direct cause-and-effect relationship. It remains uncertain whether the presence of Immigrants from Central America influences an upward or downward trend in the level of wage/income gap percentage within an area, or if Immigrants from Central America simply ended up residing in those areas with higher or lower levels of wage/income gap percentage due to other factors.
Demographics Similar to Immigrants from Central America by Wage/Income Gap
In terms of wage/income gap, the demographic groups most similar to Immigrants from Central America are Yup'ik (24.7%, a difference of 0.050%), Immigrants from Uruguay (24.6%, a difference of 0.070%), German Russian (24.6%, a difference of 0.070%), Alsatian (24.7%, a difference of 0.080%), and Spanish American (24.6%, a difference of 0.090%).
| Demographics | Rating | Rank | Wage/Income Gap |
| Immigrants from Thailand | 94.9 /100 | #121 | Exceptional 24.5% |
| Apache | 94.8 /100 | #122 | Exceptional 24.5% |
| Natives/Alaskans | 94.6 /100 | #123 | Exceptional 24.6% |
| Immigrants from South America | 93.9 /100 | #124 | Exceptional 24.6% |
| Spanish Americans | 93.8 /100 | #125 | Exceptional 24.6% |
| Immigrants from Uruguay | 93.8 /100 | #126 | Exceptional 24.6% |
| German Russians | 93.7 /100 | #127 | Exceptional 24.6% |
| Immigrants from Central America | 93.5 /100 | #128 | Exceptional 24.6% |
| Yup'ik | 93.3 /100 | #129 | Exceptional 24.7% |
| Alsatians | 93.2 /100 | #130 | Exceptional 24.7% |
| Immigrants from Philippines | 93.0 /100 | #131 | Exceptional 24.7% |
| Immigrants from Costa Rica | 92.4 /100 | #132 | Exceptional 24.7% |
| Colombians | 92.4 /100 | #133 | Exceptional 24.7% |
| Mexican American Indians | 92.2 /100 | #134 | Exceptional 24.7% |
| South American Indians | 92.0 /100 | #135 | Exceptional 24.7% |
Immigrants from Central America Wage/Income Gap Correlation Summary
| Measurement | Immigrants from Central America Data | Wage/Income Gap Data |
| Minimum | 0.25% | 13.9% |
| Maximum | 62.9% | 47.0% |
| Range | 62.7% | 33.1% |
| Mean | 27.8% | 26.4% |
| Median | 27.3% | 25.0% |
| Interquartile 25% (IQ1) | 13.5% | 23.3% |
| Interquartile 75% (IQ3) | 41.0% | 27.9% |
| Interquartile Range (IQR) | 27.5% | 4.6% |
| Standard Deviation (Sample) | 16.7% | 5.7% |
| Standard Deviation (Population) | 16.6% | 5.7% |
Correlation Details
| Immigrants from Central America Percentile | Sample Size | Wage/Income Gap |
[ 0.0% - 0.5% ] 0.25% | 87,046,187 | 29.2% |
[ 0.5% - 1.0% ] 0.73% | 67,626,359 | 29.7% |
[ 1.0% - 1.5% ] 1.24% | 53,601,538 | 28.6% |
[ 1.5% - 2.0% ] 1.75% | 41,978,949 | 28.2% |
[ 2.0% - 2.5% ] 2.24% | 30,946,504 | 26.9% |
[ 2.5% - 3.0% ] 2.74% | 23,746,703 | 26.3% |
[ 3.0% - 3.5% ] 3.25% | 28,357,349 | 22.4% |
[ 3.5% - 4.0% ] 3.73% | 16,093,894 | 26.6% |
[ 4.0% - 4.5% ] 4.24% | 13,115,325 | 26.5% |
[ 4.5% - 5.0% ] 4.72% | 13,917,232 | 25.8% |
[ 5.0% - 5.5% ] 5.26% | 10,885,484 | 25.4% |
[ 5.5% - 6.0% ] 5.74% | 10,091,506 | 25.0% |
[ 6.0% - 6.5% ] 6.25% | 8,336,890 | 25.4% |
[ 6.5% - 7.0% ] 6.72% | 8,204,004 | 24.7% |
[ 7.0% - 7.5% ] 7.26% | 6,672,902 | 24.7% |
[ 7.5% - 8.0% ] 7.71% | 5,542,418 | 24.7% |
[ 8.0% - 8.5% ] 8.29% | 5,782,938 | 25.2% |
[ 8.5% - 9.0% ] 8.77% | 7,337,851 | 21.6% |
[ 9.0% - 9.5% ] 9.27% | 5,767,425 | 23.4% |
[ 9.5% - 10.0% ] 9.74% | 8,184,882 | 23.7% |
[ 10.0% - 10.5% ] 10.22% | 4,437,645 | 23.7% |
[ 10.5% - 11.0% ] 10.75% | 3,937,397 | 22.2% |
[ 11.0% - 11.5% ] 11.26% | 2,713,617 | 22.4% |
[ 11.5% - 12.0% ] 11.70% | 1,871,291 | 25.4% |
[ 12.0% - 12.5% ] 12.27% | 2,889,903 | 24.6% |
[ 12.5% - 13.0% ] 12.73% | 4,399,695 | 20.4% |
[ 13.0% - 13.5% ] 13.26% | 2,618,864 | 24.8% |
[ 13.5% - 14.0% ] 13.74% | 2,850,407 | 25.1% |
[ 14.0% - 14.5% ] 14.24% | 2,859,355 | 25.0% |
[ 14.5% - 15.0% ] 14.76% | 1,866,746 | 24.6% |
[ 15.0% - 15.5% ] 15.19% | 2,262,527 | 26.2% |
[ 15.5% - 16.0% ] 15.76% | 1,860,623 | 25.5% |
[ 16.0% - 16.5% ] 16.26% | 1,575,591 | 23.5% |
[ 16.5% - 17.0% ] 16.65% | 3,019,847 | 23.6% |
[ 17.0% - 17.5% ] 17.18% | 3,704,575 | 21.8% |
[ 17.5% - 18.0% ] 17.74% | 1,999,831 | 25.2% |
[ 18.0% - 18.5% ] 18.25% | 1,686,832 | 23.2% |
[ 18.5% - 19.0% ] 18.74% | 2,502,785 | 24.3% |
[ 19.0% - 19.5% ] 19.26% | 1,390,844 | 24.9% |
[ 19.5% - 20.0% ] 19.74% | 1,368,199 | 23.1% |
[ 20.0% - 20.5% ] 20.09% | 6,092,449 | 19.3% |
[ 20.5% - 21.0% ] 20.77% | 1,402,408 | 25.0% |
[ 21.0% - 21.5% ] 21.28% | 992,692 | 22.2% |
[ 21.5% - 22.0% ] 21.78% | 1,205,483 | 25.3% |
[ 22.0% - 22.5% ] 22.30% | 894,569 | 24.0% |
[ 22.5% - 23.0% ] 22.73% | 919,089 | 26.9% |
[ 23.0% - 23.5% ] 23.28% | 1,498,573 | 28.0% |
[ 23.5% - 24.0% ] 23.79% | 1,086,575 | 28.4% |
[ 24.0% - 24.5% ] 24.29% | 1,134,060 | 22.7% |
[ 24.5% - 25.0% ] 24.75% | 855,177 | 27.2% |
[ 25.0% - 25.5% ] 25.30% | 710,648 | 29.0% |
[ 25.5% - 26.0% ] 25.84% | 600,349 | 28.0% |
[ 26.0% - 26.5% ] 26.23% | 1,072,267 | 24.5% |
[ 26.5% - 27.0% ] 26.72% | 486,589 | 24.7% |
[ 27.0% - 27.5% ] 27.32% | 534,287 | 27.0% |
[ 27.5% - 28.0% ] 27.68% | 1,049,546 | 21.1% |
[ 28.0% - 28.5% ] 28.23% | 562,283 | 24.1% |
[ 28.5% - 29.0% ] 28.70% | 344,572 | 31.4% |
[ 29.0% - 29.5% ] 29.30% | 786,483 | 24.2% |
[ 29.5% - 30.0% ] 29.78% | 561,861 | 29.5% |
[ 30.0% - 30.5% ] 30.26% | 496,660 | 23.9% |
[ 30.5% - 31.0% ] 30.82% | 231,377 | 25.8% |
[ 31.0% - 31.5% ] 31.17% | 205,702 | 29.7% |
[ 31.5% - 32.0% ] 31.73% | 995,540 | 21.3% |
[ 32.0% - 32.5% ] 32.25% | 273,388 | 21.4% |
[ 32.5% - 33.0% ] 32.68% | 360,371 | 24.8% |
[ 33.0% - 33.5% ] 33.38% | 212,923 | 20.4% |
[ 33.5% - 34.0% ] 33.80% | 389,621 | 24.4% |
[ 34.0% - 34.5% ] 34.40% | 203,623 | 23.0% |
[ 34.5% - 35.0% ] 34.70% | 165,634 | 29.4% |
[ 35.0% - 35.5% ] 35.21% | 64,239 | 24.3% |
[ 35.5% - 36.0% ] 35.63% | 139,198 | 27.7% |
[ 36.0% - 36.5% ] 36.37% | 309,570 | 24.5% |
[ 36.5% - 37.0% ] 36.73% | 334,201 | 27.0% |
[ 37.0% - 37.5% ] 37.31% | 191,253 | 22.9% |
[ 37.5% - 38.0% ] 37.80% | 224,882 | 21.4% |
[ 38.0% - 38.5% ] 38.25% | 196,021 | 25.7% |
[ 38.5% - 39.0% ] 38.69% | 144,787 | 20.8% |
[ 39.0% - 39.5% ] 39.32% | 151,149 | 18.9% |
[ 39.5% - 40.0% ] 39.69% | 289,992 | 22.1% |
[ 40.0% - 40.5% ] 40.20% | 126,206 | 27.1% |
[ 40.5% - 41.0% ] 40.73% | 255,266 | 24.7% |
[ 41.0% - 41.5% ] 41.33% | 25,013 | 30.8% |
[ 41.5% - 42.0% ] 41.71% | 207,858 | 24.5% |
[ 42.0% - 42.5% ] 42.14% | 83,626 | 36.9% |
[ 42.5% - 43.0% ] 42.75% | 5,240 | 40.5% |
[ 43.0% - 43.5% ] 43.44% | 49,238 | 19.2% |
[ 43.5% - 44.0% ] 43.67% | 109,004 | 20.9% |
[ 44.0% - 44.5% ] 44.29% | 260,184 | 20.7% |
[ 44.5% - 45.0% ] 44.82% | 45,508 | 24.8% |
[ 45.0% - 45.5% ] 45.37% | 12,491 | 28.8% |
[ 45.5% - 46.0% ] 45.81% | 80,835 | 33.6% |
[ 46.0% - 46.5% ] 46.25% | 9,508 | 46.2% |
[ 46.5% - 47.0% ] 46.88% | 56,210 | 25.0% |
[ 48.0% - 48.5% ] 48.22% | 4,231 | 47.0% |
[ 48.5% - 49.0% ] 48.71% | 10,034 | 17.7% |
[ 49.5% - 50.0% ] 49.57% | 2,223 | 13.9% |
[ 50.0% - 50.5% ] 50.37% | 19,115 | 39.9% |
[ 51.0% - 51.5% ] 51.33% | 5,922 | 23.0% |
[ 51.5% - 52.0% ] 51.91% | 13,463 | 38.7% |
[ 52.0% - 52.5% ] 52.34% | 2,432 | 35.6% |
[ 53.0% - 53.5% ] 53.49% | 2,610 | 44.8% |
[ 54.0% - 54.5% ] 54.39% | 21,778 | 27.8% |
[ 56.0% - 56.5% ] 56.32% | 14,541 | 42.0% |
[ 58.0% - 58.5% ] 58.24% | 182 | 27.7% |
[ 58.5% - 59.0% ] 58.59% | 6,313 | 39.9% |
[ 59.0% - 59.5% ] 59.29% | 113 | 30.0% |
[ 59.5% - 60.0% ] 59.89% | 1,112 | 33.9% |
[ 62.5% - 63.0% ] 62.93% | 1,748 | 27.6% |