South African Wage/Income Gap
COMPARE
South African
Select to Compare
Wage/Income Gap
South African Wage/Income Gap
28.0%
WAGE/INCOME GAP
0.5/ 100
METRIC RATING
282nd/ 347
METRIC RANK
South African Wage/Income Gap Correlation Chart
The statistical analysis conducted on geographies consisting of 182,544,146 people shows a substantial positive correlation between the proportion of South Africans and wage/income gap percentage in the United States with a correlation coefficient (R) of 0.535 and weighted average of 28.0%. On average, for every 1% (one percent) increase in South Africans within a typical geography, there is an increase of 1.7% in wage/income gap percentage.
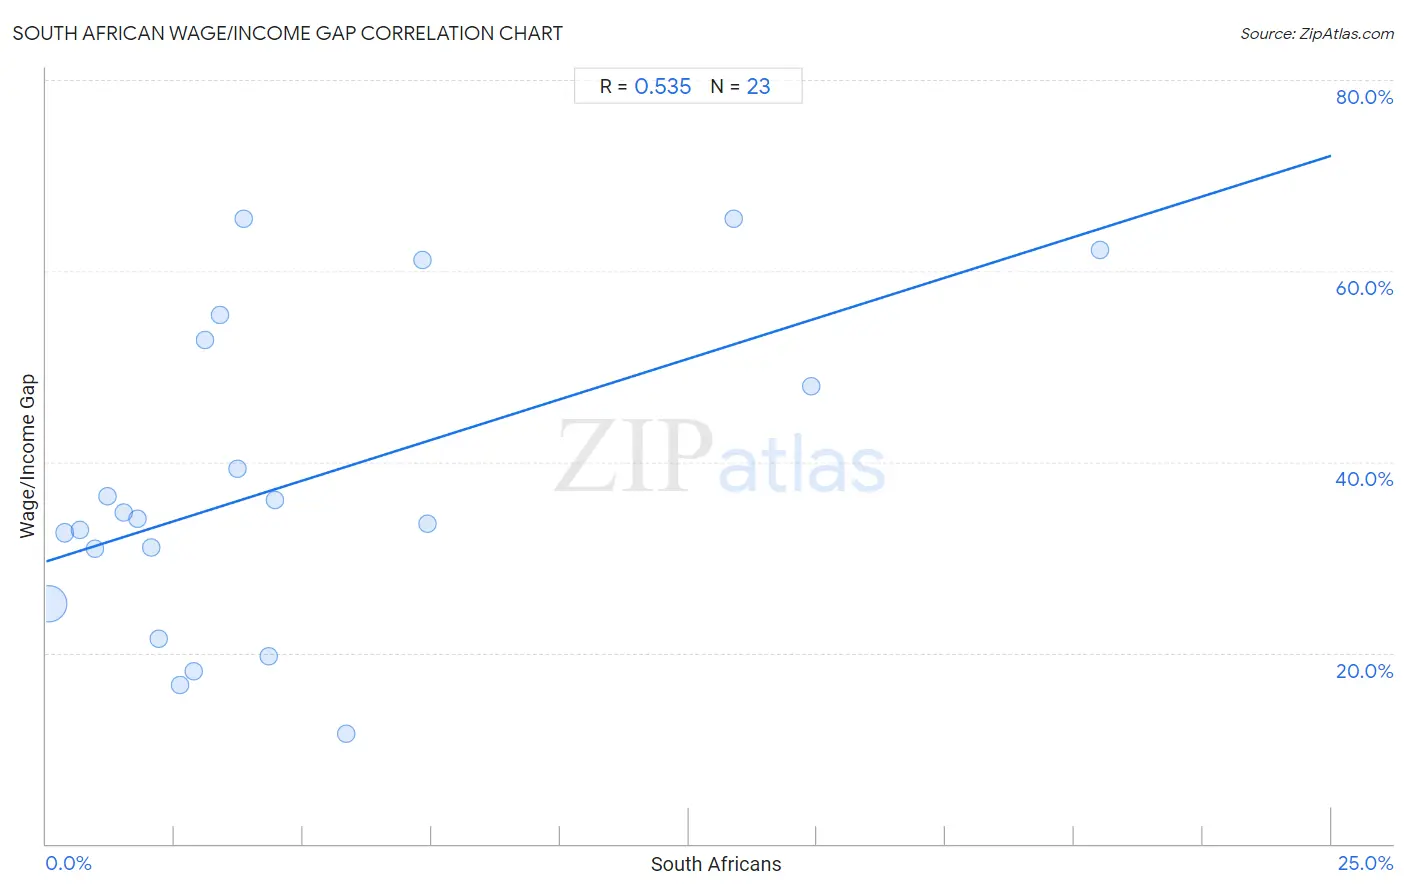
It is essential to understand that the correlation between the percentage of South Africans and wage/income gap percentage does not imply a direct cause-and-effect relationship. It remains uncertain whether the presence of South Africans influences an upward or downward trend in the level of wage/income gap percentage within an area, or if South Africans simply ended up residing in those areas with higher or lower levels of wage/income gap percentage due to other factors.
Demographics Similar to South Africans by Wage/Income Gap
In terms of wage/income gap, the demographic groups most similar to South Africans are Burmese (28.0%, a difference of 0.030%), Russian (28.0%, a difference of 0.080%), French Canadian (28.1%, a difference of 0.18%), Immigrants from Sweden (28.1%, a difference of 0.18%), and Romanian (28.0%, a difference of 0.23%).
| Demographics | Rating | Rank | Wage/Income Gap |
| Immigrants from Japan | 0.7 /100 | #275 | Tragic 27.9% |
| Lebanese | 0.7 /100 | #276 | Tragic 27.9% |
| Latvians | 0.7 /100 | #277 | Tragic 27.9% |
| Immigrants from England | 0.6 /100 | #278 | Tragic 27.9% |
| Romanians | 0.5 /100 | #279 | Tragic 28.0% |
| Russians | 0.5 /100 | #280 | Tragic 28.0% |
| Burmese | 0.5 /100 | #281 | Tragic 28.0% |
| South Africans | 0.5 /100 | #282 | Tragic 28.0% |
| French Canadians | 0.4 /100 | #283 | Tragic 28.1% |
| Immigrants from Sweden | 0.4 /100 | #284 | Tragic 28.1% |
| Italians | 0.4 /100 | #285 | Tragic 28.1% |
| Immigrants from Austria | 0.4 /100 | #286 | Tragic 28.1% |
| Okinawans | 0.4 /100 | #287 | Tragic 28.1% |
| Choctaw | 0.4 /100 | #288 | Tragic 28.1% |
| Canadians | 0.3 /100 | #289 | Tragic 28.1% |
South African Wage/Income Gap Correlation Summary
| Measurement | South African Data | Wage/Income Gap Data |
| Minimum | 0.053% | 11.5% |
| Maximum | 20.5% | 65.5% |
| Range | 20.4% | 54.0% |
| Mean | 4.7% | 37.6% |
| Median | 3.1% | 34.0% |
| Interquartile 25% (IQ1) | 1.5% | 25.1% |
| Interquartile 75% (IQ3) | 5.8% | 52.7% |
| Interquartile Range (IQR) | 4.3% | 27.6% |
| Standard Deviation (Sample) | 5.1% | 16.2% |
| Standard Deviation (Population) | 5.0% | 15.9% |
Correlation Details
| South African Percentile | Sample Size | Wage/Income Gap |
[ 0.0% - 0.5% ] 0.053% | 173,890,532 | 25.1% |
[ 0.0% - 0.5% ] 0.36% | 5,952,079 | 32.6% |
[ 0.5% - 1.0% ] 0.66% | 1,545,914 | 32.9% |
[ 0.5% - 1.0% ] 0.95% | 549,041 | 30.9% |
[ 1.0% - 1.5% ] 1.18% | 171,997 | 36.4% |
[ 1.0% - 1.5% ] 1.50% | 148,640 | 34.7% |
[ 1.5% - 2.0% ] 1.77% | 68,471 | 34.0% |
[ 2.0% - 2.5% ] 2.04% | 55,884 | 31.0% |
[ 2.0% - 2.5% ] 2.20% | 21,693 | 21.5% |
[ 2.5% - 3.0% ] 2.59% | 31,885 | 16.6% |
[ 2.5% - 3.0% ] 2.87% | 19,295 | 18.1% |
[ 3.0% - 3.5% ] 3.08% | 36,878 | 52.7% |
[ 3.0% - 3.5% ] 3.37% | 4,717 | 55.4% |
[ 3.5% - 4.0% ] 3.73% | 9,758 | 39.3% |
[ 3.5% - 4.0% ] 3.84% | 26,498 | 65.5% |
[ 4.0% - 4.5% ] 4.34% | 4,450 | 19.6% |
[ 4.0% - 4.5% ] 4.46% | 3,541 | 36.0% |
[ 5.5% - 6.0% ] 5.84% | 377 | 11.5% |
[ 7.0% - 7.5% ] 7.33% | 1,638 | 61.1% |
[ 7.0% - 7.5% ] 7.41% | 216 | 33.5% |
[ 13.0% - 13.5% ] 13.37% | 172 | 65.5% |
[ 14.5% - 15.0% ] 14.89% | 309 | 47.9% |
[ 20.0% - 20.5% ] 20.50% | 161 | 62.2% |