Ghanaian Wage/Income Gap
COMPARE
Ghanaian
Select to Compare
Wage/Income Gap
Ghanaian Wage/Income Gap
22.3%
WAGE/INCOME GAP
100.0/ 100
METRIC RATING
57th/ 347
METRIC RANK
Ghanaian Wage/Income Gap Correlation Chart
The statistical analysis conducted on geographies consisting of 190,692,121 people shows no correlation between the proportion of Ghanaians and wage/income gap percentage in the United States with a correlation coefficient (R) of -0.046 and weighted average of 22.3%. On average, for every 1% (one percent) increase in Ghanaians within a typical geography, there is a decrease of 0.25% in wage/income gap percentage.
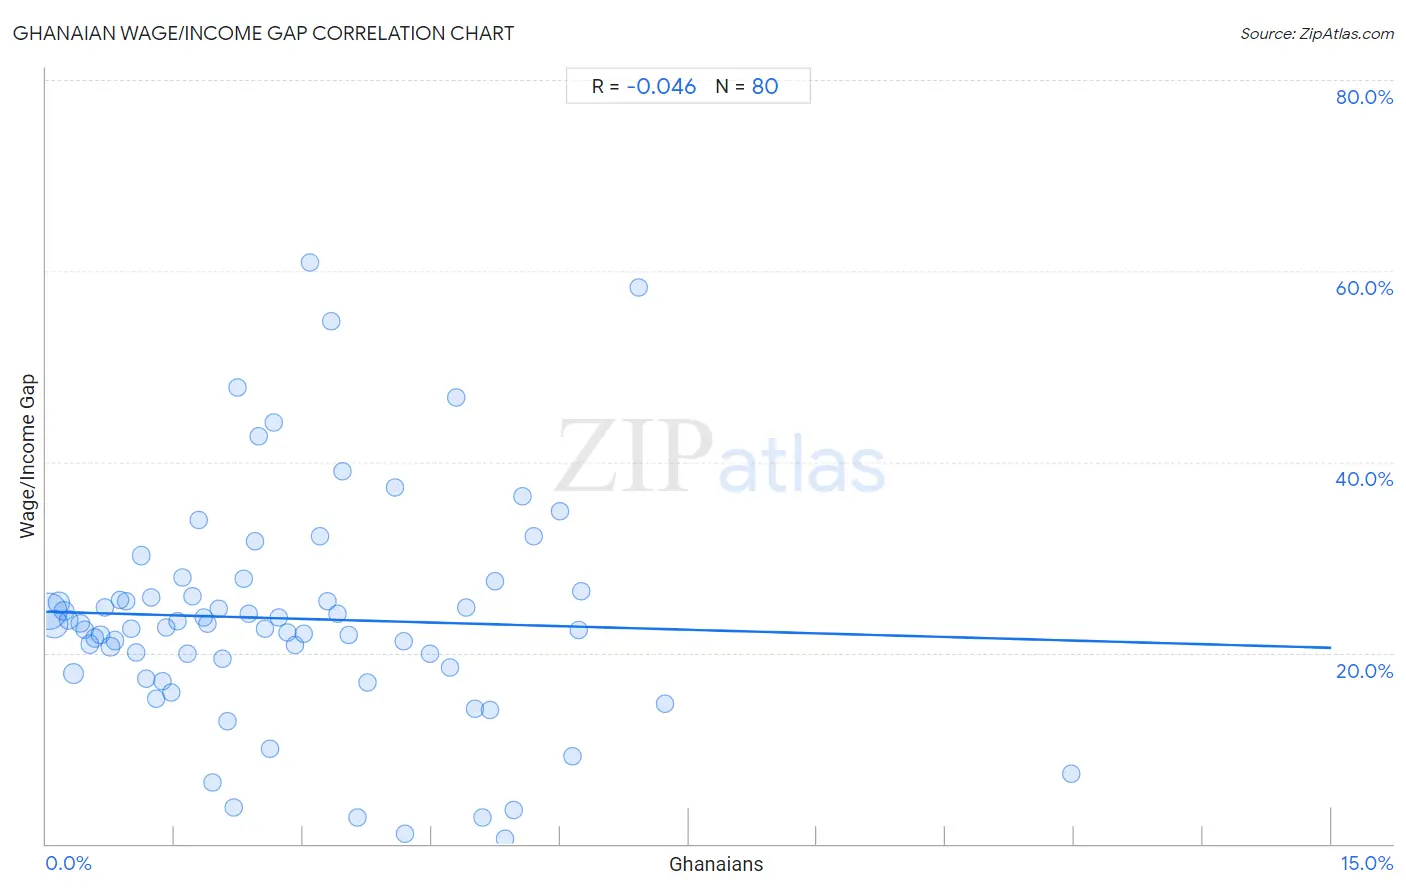
It is essential to understand that the correlation between the percentage of Ghanaians and wage/income gap percentage does not imply a direct cause-and-effect relationship. It remains uncertain whether the presence of Ghanaians influences an upward or downward trend in the level of wage/income gap percentage within an area, or if Ghanaians simply ended up residing in those areas with higher or lower levels of wage/income gap percentage due to other factors.
Demographics Similar to Ghanaians by Wage/Income Gap
In terms of wage/income gap, the demographic groups most similar to Ghanaians are Immigrants from Cuba (22.4%, a difference of 0.080%), Immigrants from Ghana (22.3%, a difference of 0.10%), Navajo (22.4%, a difference of 0.12%), Immigrants from Zaire (22.3%, a difference of 0.13%), and Immigrants from Middle Africa (22.4%, a difference of 0.14%).
| Demographics | Rating | Rank | Wage/Income Gap |
| Immigrants from Western Africa | 100.0 /100 | #50 | Exceptional 22.0% |
| Tohono O'odham | 100.0 /100 | #51 | Exceptional 22.1% |
| Immigrants from Cameroon | 100.0 /100 | #52 | Exceptional 22.2% |
| Bangladeshis | 100.0 /100 | #53 | Exceptional 22.2% |
| Nepalese | 100.0 /100 | #54 | Exceptional 22.2% |
| Immigrants from Zaire | 100.0 /100 | #55 | Exceptional 22.3% |
| Immigrants from Ghana | 100.0 /100 | #56 | Exceptional 22.3% |
| Ghanaians | 100.0 /100 | #57 | Exceptional 22.3% |
| Immigrants from Cuba | 100.0 /100 | #58 | Exceptional 22.4% |
| Navajo | 100.0 /100 | #59 | Exceptional 22.4% |
| Immigrants from Middle Africa | 100.0 /100 | #60 | Exceptional 22.4% |
| Immigrants from Fiji | 100.0 /100 | #61 | Exceptional 22.4% |
| Immigrants from Guatemala | 100.0 /100 | #62 | Exceptional 22.5% |
| Immigrants from Ecuador | 100.0 /100 | #63 | Exceptional 22.5% |
| Spanish American Indians | 100.0 /100 | #64 | Exceptional 22.5% |
Ghanaian Wage/Income Gap Correlation Summary
| Measurement | Ghanaian Data | Wage/Income Gap Data |
| Minimum | 0.028% | 0.52% |
| Maximum | 12.0% | 60.8% |
| Range | 11.9% | 60.3% |
| Mean | 2.8% | 23.6% |
| Median | 2.4% | 22.8% |
| Interquartile 25% (IQ1) | 1.2% | 18.1% |
| Interquartile 75% (IQ3) | 4.2% | 26.2% |
| Interquartile Range (IQR) | 3.0% | 8.0% |
| Standard Deviation (Sample) | 2.1% | 11.9% |
| Standard Deviation (Population) | 2.1% | 11.8% |
Correlation Details
| Ghanaian Percentile | Sample Size | Wage/Income Gap |
[ 0.0% - 0.5% ] 0.028% | 84,693,809 | 24.4% |
[ 0.0% - 0.5% ] 0.088% | 42,475,821 | 23.0% |
[ 0.0% - 0.5% ] 0.15% | 15,004,328 | 25.2% |
[ 0.0% - 0.5% ] 0.21% | 8,619,961 | 24.4% |
[ 0.0% - 0.5% ] 0.27% | 6,210,435 | 23.4% |
[ 0.0% - 0.5% ] 0.32% | 12,771,274 | 17.8% |
[ 0.0% - 0.5% ] 0.39% | 3,387,302 | 23.1% |
[ 0.0% - 0.5% ] 0.45% | 2,818,597 | 22.4% |
[ 0.5% - 1.0% ] 0.51% | 1,749,611 | 20.9% |
[ 0.5% - 1.0% ] 0.57% | 1,313,301 | 21.6% |
[ 0.5% - 1.0% ] 0.63% | 1,995,893 | 21.9% |
[ 0.5% - 1.0% ] 0.68% | 801,433 | 24.7% |
[ 0.5% - 1.0% ] 0.75% | 1,421,950 | 20.6% |
[ 0.5% - 1.0% ] 0.80% | 666,045 | 21.3% |
[ 0.5% - 1.0% ] 0.87% | 529,793 | 25.5% |
[ 0.5% - 1.0% ] 0.93% | 450,837 | 25.4% |
[ 0.5% - 1.0% ] 0.99% | 370,267 | 22.6% |
[ 1.0% - 1.5% ] 1.05% | 567,076 | 20.0% |
[ 1.0% - 1.5% ] 1.10% | 231,909 | 30.2% |
[ 1.0% - 1.5% ] 1.17% | 321,189 | 17.3% |
[ 1.0% - 1.5% ] 1.22% | 323,918 | 25.8% |
[ 1.0% - 1.5% ] 1.28% | 443,712 | 15.2% |
[ 1.0% - 1.5% ] 1.35% | 191,471 | 17.1% |
[ 1.0% - 1.5% ] 1.40% | 339,224 | 22.6% |
[ 1.0% - 1.5% ] 1.46% | 232,886 | 15.9% |
[ 1.5% - 2.0% ] 1.53% | 62,787 | 23.3% |
[ 1.5% - 2.0% ] 1.58% | 192,410 | 27.9% |
[ 1.5% - 2.0% ] 1.65% | 209,236 | 19.9% |
[ 1.5% - 2.0% ] 1.71% | 115,620 | 25.9% |
[ 1.5% - 2.0% ] 1.78% | 77,677 | 33.9% |
[ 1.5% - 2.0% ] 1.84% | 252,368 | 23.7% |
[ 1.5% - 2.0% ] 1.88% | 280,547 | 23.1% |
[ 1.5% - 2.0% ] 1.94% | 75,155 | 6.4% |
[ 2.0% - 2.5% ] 2.02% | 126,465 | 24.6% |
[ 2.0% - 2.5% ] 2.06% | 85,128 | 19.3% |
[ 2.0% - 2.5% ] 2.12% | 118,697 | 12.8% |
[ 2.0% - 2.5% ] 2.19% | 3,424 | 3.8% |
[ 2.0% - 2.5% ] 2.23% | 14,296 | 47.8% |
[ 2.0% - 2.5% ] 2.31% | 36,119 | 27.7% |
[ 2.0% - 2.5% ] 2.37% | 38,913 | 24.1% |
[ 2.0% - 2.5% ] 2.44% | 84,014 | 31.7% |
[ 2.0% - 2.5% ] 2.49% | 6,916 | 42.7% |
[ 2.5% - 3.0% ] 2.55% | 231,804 | 22.5% |
[ 2.5% - 3.0% ] 2.61% | 16,183 | 9.9% |
[ 2.5% - 3.0% ] 2.66% | 6,773 | 44.1% |
[ 2.5% - 3.0% ] 2.72% | 181,389 | 23.7% |
[ 2.5% - 3.0% ] 2.81% | 13,927 | 22.1% |
[ 2.5% - 3.0% ] 2.91% | 9,389 | 20.8% |
[ 3.0% - 3.5% ] 3.01% | 47,793 | 22.0% |
[ 3.0% - 3.5% ] 3.08% | 3,638 | 60.8% |
[ 3.0% - 3.5% ] 3.19% | 2,694 | 32.3% |
[ 3.0% - 3.5% ] 3.28% | 22,049 | 25.5% |
[ 3.0% - 3.5% ] 3.33% | 38,632 | 54.8% |
[ 3.0% - 3.5% ] 3.40% | 19,605 | 24.0% |
[ 3.0% - 3.5% ] 3.46% | 1,705 | 39.1% |
[ 3.5% - 4.0% ] 3.52% | 36,265 | 21.9% |
[ 3.5% - 4.0% ] 3.64% | 22,966 | 2.8% |
[ 3.5% - 4.0% ] 3.75% | 55,168 | 16.9% |
[ 4.0% - 4.5% ] 4.08% | 19,938 | 37.4% |
[ 4.0% - 4.5% ] 4.17% | 30,590 | 21.2% |
[ 4.0% - 4.5% ] 4.19% | 2,980 | 1.0% |
[ 4.0% - 4.5% ] 4.47% | 72,215 | 19.9% |
[ 4.5% - 5.0% ] 4.71% | 2,101 | 18.5% |
[ 4.5% - 5.0% ] 4.79% | 376 | 46.7% |
[ 4.5% - 5.0% ] 4.91% | 23,110 | 24.7% |
[ 5.0% - 5.5% ] 5.01% | 43,231 | 14.2% |
[ 5.0% - 5.5% ] 5.09% | 2,474 | 2.8% |
[ 5.0% - 5.5% ] 5.18% | 733 | 14.0% |
[ 5.0% - 5.5% ] 5.24% | 15,508 | 27.5% |
[ 5.0% - 5.5% ] 5.35% | 299 | 0.52% |
[ 5.0% - 5.5% ] 5.46% | 293 | 3.5% |
[ 5.5% - 6.0% ] 5.56% | 1,798 | 36.4% |
[ 5.5% - 6.0% ] 5.69% | 1,107 | 32.2% |
[ 6.0% - 6.5% ] 6.00% | 22,505 | 34.8% |
[ 6.0% - 6.5% ] 6.14% | 1,010 | 9.2% |
[ 6.0% - 6.5% ] 6.21% | 22,114 | 22.4% |
[ 6.0% - 6.5% ] 6.24% | 2,034 | 26.4% |
[ 6.5% - 7.0% ] 6.92% | 1,041 | 58.2% |
[ 7.0% - 7.5% ] 7.22% | 3,575 | 14.6% |
[ 11.5% - 12.0% ] 11.97% | 1,295 | 7.3% |