Puerto Rican Wage/Income Gap
COMPARE
Puerto Rican
Select to Compare
Wage/Income Gap
Puerto Rican Wage/Income Gap
18.7%
WAGE/INCOME GAP
100.0/ 100
METRIC RATING
7th/ 347
METRIC RANK
Puerto Rican Wage/Income Gap Correlation Chart
The statistical analysis conducted on geographies consisting of 527,155,694 people shows a substantial negative correlation between the proportion of Puerto Ricans and wage/income gap percentage in the United States with a correlation coefficient (R) of -0.524 and weighted average of 18.7%. On average, for every 1% (one percent) increase in Puerto Ricans within a typical geography, there is a decrease of 0.14% in wage/income gap percentage.
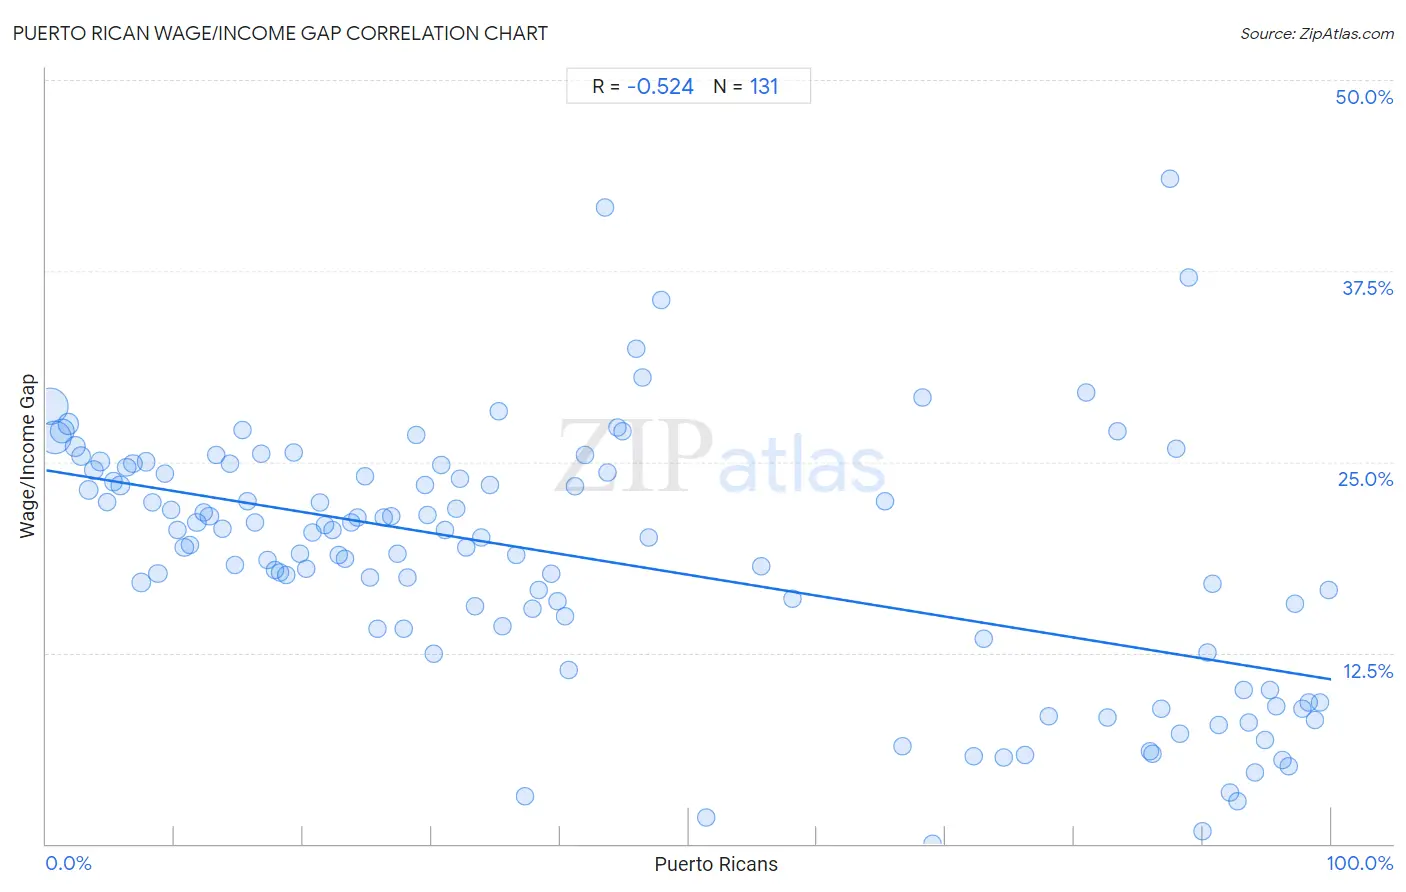
It is essential to understand that the correlation between the percentage of Puerto Ricans and wage/income gap percentage does not imply a direct cause-and-effect relationship. It remains uncertain whether the presence of Puerto Ricans influences an upward or downward trend in the level of wage/income gap percentage within an area, or if Puerto Ricans simply ended up residing in those areas with higher or lower levels of wage/income gap percentage due to other factors.
Demographics Similar to Puerto Ricans by Wage/Income Gap
In terms of wage/income gap, the demographic groups most similar to Puerto Ricans are Immigrants from Jamaica (18.8%, a difference of 0.63%), Barbadian (19.0%, a difference of 1.3%), Crow (19.1%, a difference of 1.8%), Immigrants from Guyana (18.4%, a difference of 2.0%), and Guyanese (18.3%, a difference of 2.3%).
| Demographics | Rating | Rank | Wage/Income Gap |
| Immigrants from Grenada | 100.0 /100 | #1 | Exceptional 16.2% |
| Immigrants from St. Vincent and the Grenadines | 100.0 /100 | #2 | Exceptional 16.4% |
| Immigrants from Barbados | 100.0 /100 | #3 | Exceptional 17.8% |
| British West Indians | 100.0 /100 | #4 | Exceptional 18.0% |
| Guyanese | 100.0 /100 | #5 | Exceptional 18.3% |
| Immigrants from Guyana | 100.0 /100 | #6 | Exceptional 18.4% |
| Puerto Ricans | 100.0 /100 | #7 | Exceptional 18.7% |
| Immigrants from Jamaica | 100.0 /100 | #8 | Exceptional 18.8% |
| Barbadians | 100.0 /100 | #9 | Exceptional 19.0% |
| Crow | 100.0 /100 | #10 | Exceptional 19.1% |
| Immigrants from Haiti | 100.0 /100 | #11 | Exceptional 19.2% |
| Immigrants from West Indies | 100.0 /100 | #12 | Exceptional 19.2% |
| Trinidadians and Tobagonians | 100.0 /100 | #13 | Exceptional 19.3% |
| Immigrants from Trinidad and Tobago | 100.0 /100 | #14 | Exceptional 19.3% |
| West Indians | 100.0 /100 | #15 | Exceptional 19.6% |
Puerto Rican Wage/Income Gap Correlation Summary
| Measurement | Puerto Rican Data | Wage/Income Gap Data |
| Minimum | 0.28% | 0.0036% |
| Maximum | 99.8% | 43.5% |
| Range | 99.5% | 43.5% |
| Mean | 42.6% | 18.6% |
| Median | 32.7% | 20.0% |
| Interquartile 25% (IQ1) | 16.3% | 13.4% |
| Interquartile 75% (IQ3) | 74.5% | 24.3% |
| Interquartile Range (IQR) | 58.3% | 10.9% |
| Standard Deviation (Sample) | 32.0% | 8.4% |
| Standard Deviation (Population) | 31.9% | 8.3% |
Correlation Details
| Puerto Rican Percentile | Sample Size | Wage/Income Gap |
[ 0.0% - 0.5% ] 0.28% | 168,844,032 | 28.7% |
[ 0.5% - 1.0% ] 0.72% | 136,563,195 | 26.6% |
[ 1.0% - 1.5% ] 1.22% | 60,759,940 | 27.0% |
[ 1.5% - 2.0% ] 1.73% | 30,241,001 | 27.5% |
[ 2.0% - 2.5% ] 2.23% | 17,823,490 | 26.0% |
[ 2.5% - 3.0% ] 2.74% | 14,131,040 | 25.4% |
[ 3.0% - 3.5% ] 3.29% | 12,947,069 | 23.2% |
[ 3.5% - 4.0% ] 3.72% | 10,140,957 | 24.5% |
[ 4.0% - 4.5% ] 4.23% | 7,288,657 | 25.0% |
[ 4.5% - 5.0% ] 4.75% | 6,951,269 | 22.4% |
[ 5.0% - 5.5% ] 5.22% | 4,673,328 | 23.7% |
[ 5.5% - 6.0% ] 5.75% | 4,774,394 | 23.5% |
[ 6.0% - 6.5% ] 6.26% | 3,517,010 | 24.6% |
[ 6.5% - 7.0% ] 6.76% | 3,456,068 | 24.9% |
[ 7.0% - 7.5% ] 7.43% | 11,174,564 | 17.1% |
[ 7.5% - 8.0% ] 7.78% | 2,252,510 | 25.0% |
[ 8.0% - 8.5% ] 8.25% | 2,096,621 | 22.4% |
[ 8.5% - 9.0% ] 8.68% | 3,948,926 | 17.7% |
[ 9.0% - 9.5% ] 9.25% | 2,109,466 | 24.2% |
[ 9.5% - 10.0% ] 9.71% | 1,968,530 | 21.9% |
[ 10.0% - 10.5% ] 10.24% | 853,218 | 20.6% |
[ 10.5% - 11.0% ] 10.75% | 1,509,114 | 19.4% |
[ 11.0% - 11.5% ] 11.21% | 881,857 | 19.6% |
[ 11.5% - 12.0% ] 11.72% | 805,391 | 21.0% |
[ 12.0% - 12.5% ] 12.21% | 629,882 | 21.7% |
[ 12.5% - 13.0% ] 12.69% | 759,473 | 21.5% |
[ 13.0% - 13.5% ] 13.21% | 581,138 | 25.4% |
[ 13.5% - 14.0% ] 13.68% | 432,499 | 20.6% |
[ 14.0% - 14.5% ] 14.30% | 778,266 | 24.9% |
[ 14.5% - 15.0% ] 14.70% | 823,036 | 18.2% |
[ 15.0% - 15.5% ] 15.32% | 150,053 | 27.1% |
[ 15.5% - 16.0% ] 15.70% | 878,798 | 22.4% |
[ 16.0% - 16.5% ] 16.25% | 435,545 | 21.0% |
[ 16.5% - 17.0% ] 16.77% | 530,073 | 25.5% |
[ 17.0% - 17.5% ] 17.25% | 241,560 | 18.5% |
[ 17.5% - 18.0% ] 17.82% | 305,332 | 17.9% |
[ 18.0% - 18.5% ] 18.16% | 367,931 | 17.8% |
[ 18.5% - 19.0% ] 18.64% | 188,944 | 17.6% |
[ 19.0% - 19.5% ] 19.27% | 201,074 | 25.6% |
[ 19.5% - 20.0% ] 19.76% | 217,840 | 19.0% |
[ 20.0% - 20.5% ] 20.23% | 92,283 | 18.0% |
[ 20.5% - 21.0% ] 20.69% | 356,079 | 20.4% |
[ 21.0% - 21.5% ] 21.29% | 317,570 | 22.3% |
[ 21.5% - 22.0% ] 21.70% | 147,601 | 20.9% |
[ 22.0% - 22.5% ] 22.26% | 69,275 | 20.5% |
[ 22.5% - 23.0% ] 22.78% | 156,169 | 18.9% |
[ 23.0% - 23.5% ] 23.26% | 259,390 | 18.6% |
[ 23.5% - 24.0% ] 23.75% | 54,725 | 21.1% |
[ 24.0% - 24.5% ] 24.21% | 192,047 | 21.3% |
[ 24.5% - 25.0% ] 24.78% | 41,372 | 24.1% |
[ 25.0% - 25.5% ] 25.17% | 74,666 | 17.5% |
[ 25.5% - 26.0% ] 25.78% | 295,213 | 14.1% |
[ 26.0% - 26.5% ] 26.24% | 113,185 | 21.4% |
[ 26.5% - 27.0% ] 26.82% | 211,727 | 21.4% |
[ 27.0% - 27.5% ] 27.29% | 115,892 | 19.0% |
[ 27.5% - 28.0% ] 27.85% | 84,009 | 14.1% |
[ 28.0% - 28.5% ] 28.10% | 207,807 | 17.4% |
[ 28.5% - 29.0% ] 28.75% | 138,085 | 26.8% |
[ 29.0% - 29.5% ] 29.43% | 90,149 | 23.5% |
[ 29.5% - 30.0% ] 29.69% | 118,990 | 21.5% |
[ 30.0% - 30.5% ] 30.13% | 50,636 | 12.4% |
[ 30.5% - 31.0% ] 30.79% | 28,965 | 24.8% |
[ 31.0% - 31.5% ] 31.05% | 50,450 | 20.5% |
[ 31.5% - 32.0% ] 31.94% | 128,309 | 21.9% |
[ 32.0% - 32.5% ] 32.18% | 62,201 | 23.9% |
[ 32.5% - 33.0% ] 32.66% | 154,688 | 19.4% |
[ 33.0% - 33.5% ] 33.32% | 121,057 | 15.5% |
[ 33.5% - 34.0% ] 33.83% | 74,212 | 20.0% |
[ 34.5% - 35.0% ] 34.57% | 71,241 | 23.5% |
[ 35.0% - 35.5% ] 35.17% | 39,166 | 28.4% |
[ 35.5% - 36.0% ] 35.53% | 13,479 | 14.3% |
[ 36.5% - 37.0% ] 36.60% | 68,321 | 18.9% |
[ 37.0% - 37.5% ] 37.23% | 19,353 | 3.1% |
[ 37.5% - 38.0% ] 37.86% | 9,467 | 15.4% |
[ 38.0% - 38.5% ] 38.35% | 16,024 | 16.6% |
[ 39.0% - 39.5% ] 39.30% | 195,614 | 17.6% |
[ 39.5% - 40.0% ] 39.75% | 51,640 | 15.9% |
[ 40.0% - 40.5% ] 40.34% | 76,094 | 14.9% |
[ 40.5% - 41.0% ] 40.69% | 69,311 | 11.4% |
[ 41.0% - 41.5% ] 41.13% | 44,030 | 23.4% |
[ 41.5% - 42.0% ] 41.93% | 62,474 | 25.4% |
[ 43.0% - 43.5% ] 43.47% | 8,418 | 41.6% |
[ 43.5% - 44.0% ] 43.72% | 70,222 | 24.3% |
[ 44.0% - 44.5% ] 44.43% | 25,642 | 27.3% |
[ 44.5% - 45.0% ] 44.86% | 43,330 | 27.0% |
[ 45.5% - 46.0% ] 45.93% | 34,257 | 32.4% |
[ 46.0% - 46.5% ] 46.38% | 1,022 | 30.5% |
[ 46.5% - 47.0% ] 46.89% | 77,830 | 20.1% |
[ 47.5% - 48.0% ] 47.85% | 466 | 35.6% |
[ 51.0% - 51.5% ] 51.41% | 22,606 | 1.7% |
[ 55.5% - 56.0% ] 55.67% | 697 | 18.2% |
[ 58.0% - 58.5% ] 58.07% | 12,443 | 16.1% |
[ 65.0% - 65.5% ] 65.24% | 12,045 | 22.4% |
[ 66.5% - 67.0% ] 66.64% | 17,495 | 6.4% |
[ 68.0% - 68.5% ] 68.15% | 7,087 | 29.2% |
[ 68.5% - 69.0% ] 68.99% | 8,220 | 0.0036% |
[ 72.0% - 72.5% ] 72.22% | 24,713 | 5.8% |
[ 72.5% - 73.0% ] 72.96% | 5,955 | 13.4% |
[ 74.5% - 75.0% ] 74.52% | 5,260 | 5.7% |
[ 76.0% - 76.5% ] 76.20% | 17,293 | 5.8% |
[ 77.5% - 78.0% ] 77.98% | 20,075 | 8.3% |
[ 80.5% - 81.0% ] 80.95% | 16,607 | 29.6% |
[ 82.5% - 83.0% ] 82.54% | 590 | 8.3% |
[ 83.0% - 83.5% ] 83.33% | 3,233 | 27.0% |
[ 85.5% - 86.0% ] 85.92% | 38,239 | 6.1% |
[ 86.0% - 86.5% ] 86.12% | 341,160 | 5.9% |
[ 86.5% - 87.0% ] 86.74% | 40,064 | 8.8% |
[ 87.0% - 87.5% ] 87.45% | 16,451 | 43.5% |
[ 87.5% - 88.0% ] 87.90% | 4,562 | 25.9% |
[ 88.0% - 88.5% ] 88.19% | 40,300 | 7.2% |
[ 88.5% - 89.0% ] 88.88% | 7,068 | 37.1% |
[ 89.5% - 90.0% ] 89.97% | 13,876 | 0.79% |
[ 90.0% - 90.5% ] 90.35% | 146,989 | 12.5% |
[ 90.5% - 91.0% ] 90.79% | 31,816 | 17.0% |
[ 91.0% - 91.5% ] 91.25% | 189,184 | 7.8% |
[ 92.0% - 92.5% ] 92.08% | 51,852 | 3.4% |
[ 92.5% - 93.0% ] 92.66% | 25,542 | 2.8% |
[ 93.0% - 93.5% ] 93.15% | 108,145 | 10.0% |
[ 93.5% - 94.0% ] 93.62% | 28,322 | 7.9% |
[ 94.0% - 94.5% ] 94.10% | 281,717 | 4.6% |
[ 94.5% - 95.0% ] 94.81% | 233,512 | 6.8% |
[ 95.0% - 95.5% ] 95.25% | 310,596 | 10.0% |
[ 95.5% - 96.0% ] 95.73% | 146,886 | 9.0% |
[ 96.0% - 96.5% ] 96.18% | 328,623 | 5.5% |
[ 96.5% - 97.0% ] 96.73% | 348,553 | 5.1% |
[ 97.0% - 97.5% ] 97.19% | 196,560 | 15.8% |
[ 97.5% - 98.0% ] 97.73% | 514,663 | 8.8% |
[ 98.0% - 98.5% ] 98.26% | 364,103 | 9.2% |
[ 98.5% - 99.0% ] 98.78% | 504,528 | 8.1% |
[ 99.0% - 99.5% ] 99.17% | 442,999 | 9.2% |
[ 99.5% - 100.0% ] 99.79% | 187,821 | 16.6% |