Ottawa Wage/Income Gap
COMPARE
Ottawa
Select to Compare
Wage/Income Gap
Ottawa Wage/Income Gap
27.0%
WAGE/INCOME GAP
5.3/ 100
METRIC RATING
230th/ 347
METRIC RANK
Ottawa Wage/Income Gap Correlation Chart
The statistical analysis conducted on geographies consisting of 49,945,393 people shows a poor negative correlation between the proportion of Ottawa and wage/income gap percentage in the United States with a correlation coefficient (R) of -0.106 and weighted average of 27.0%. On average, for every 1% (one percent) increase in Ottawa within a typical geography, there is a decrease of 0.48% in wage/income gap percentage.
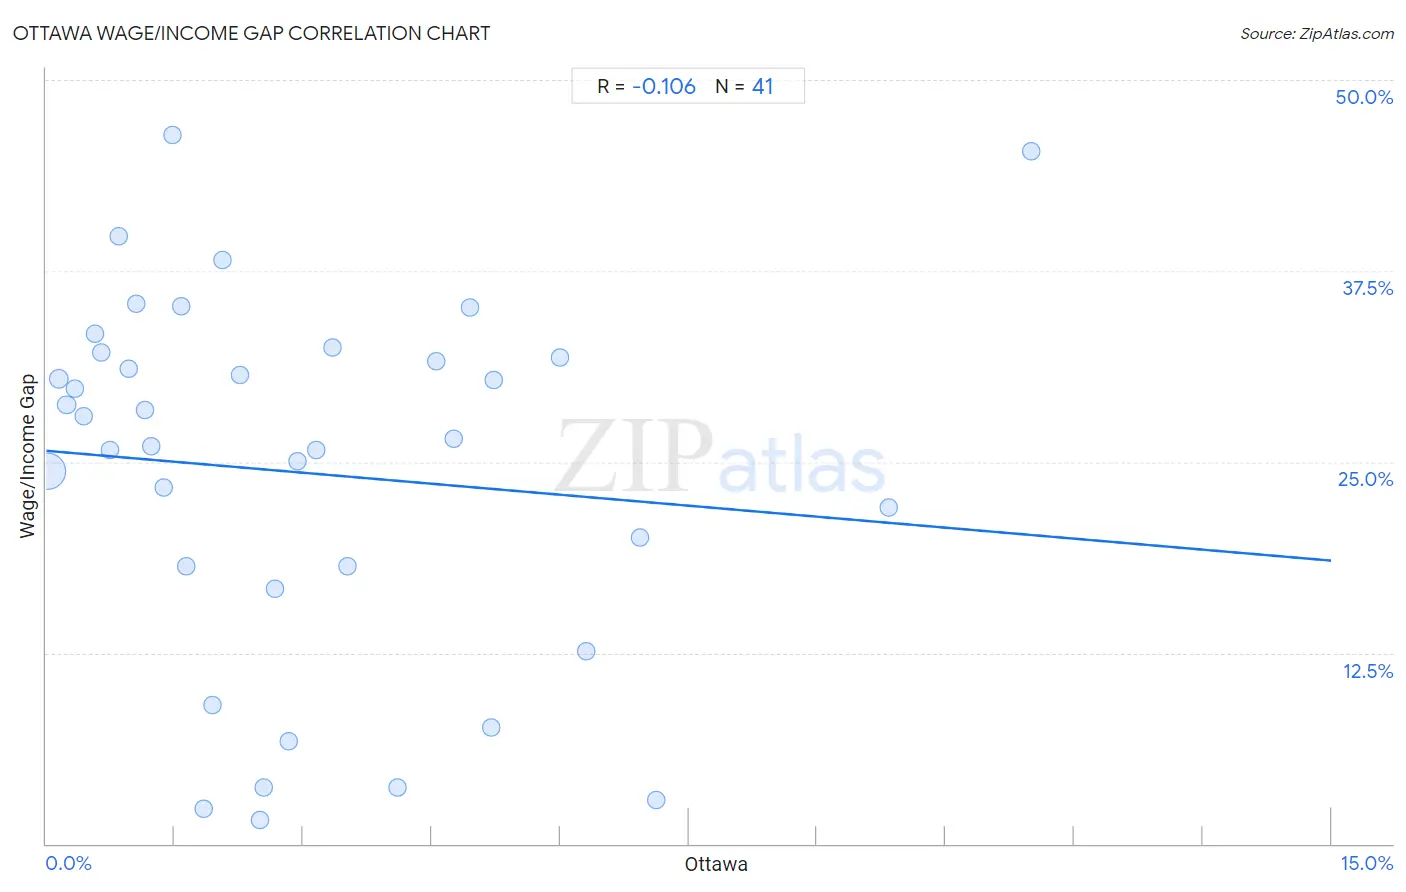
It is essential to understand that the correlation between the percentage of Ottawa and wage/income gap percentage does not imply a direct cause-and-effect relationship. It remains uncertain whether the presence of Ottawa influences an upward or downward trend in the level of wage/income gap percentage within an area, or if Ottawa simply ended up residing in those areas with higher or lower levels of wage/income gap percentage due to other factors.
Demographics Similar to Ottawa by Wage/Income Gap
In terms of wage/income gap, the demographic groups most similar to Ottawa are Bhutanese (27.0%, a difference of 0.030%), Immigrants from Asia (27.0%, a difference of 0.050%), Argentinean (27.0%, a difference of 0.050%), Immigrants from Turkey (27.0%, a difference of 0.080%), and Spaniard (27.0%, a difference of 0.090%).
| Demographics | Rating | Rank | Wage/Income Gap |
| Jordanians | 8.0 /100 | #223 | Tragic 26.8% |
| Immigrants from Argentina | 7.2 /100 | #224 | Tragic 26.8% |
| Immigrants from Ireland | 6.5 /100 | #225 | Tragic 26.9% |
| Asians | 5.9 /100 | #226 | Tragic 26.9% |
| Spaniards | 5.6 /100 | #227 | Tragic 27.0% |
| Immigrants from Turkey | 5.6 /100 | #228 | Tragic 27.0% |
| Immigrants from Asia | 5.5 /100 | #229 | Tragic 27.0% |
| Ottawa | 5.3 /100 | #230 | Tragic 27.0% |
| Bhutanese | 5.3 /100 | #231 | Tragic 27.0% |
| Argentineans | 5.2 /100 | #232 | Tragic 27.0% |
| Immigrants from Brazil | 5.0 /100 | #233 | Tragic 27.0% |
| Immigrants from Pakistan | 4.9 /100 | #234 | Tragic 27.0% |
| Immigrants from Hungary | 4.8 /100 | #235 | Tragic 27.0% |
| Immigrants from Romania | 4.8 /100 | #236 | Tragic 27.0% |
| Immigrants from Eastern Asia | 4.4 /100 | #237 | Tragic 27.1% |
Ottawa Wage/Income Gap Correlation Summary
| Measurement | Ottawa Data | Wage/Income Gap Data |
| Minimum | 0.015% | 1.6% |
| Maximum | 11.5% | 46.4% |
| Range | 11.5% | 44.8% |
| Mean | 3.0% | 24.3% |
| Median | 2.3% | 26.5% |
| Interquartile 25% (IQ1) | 1.0% | 17.4% |
| Interquartile 75% (IQ3) | 4.7% | 32.0% |
| Interquartile Range (IQR) | 3.6% | 14.6% |
| Standard Deviation (Sample) | 2.6% | 12.0% |
| Standard Deviation (Population) | 2.6% | 11.8% |
Correlation Details
| Ottawa Percentile | Sample Size | Wage/Income Gap |
[ 0.0% - 0.5% ] 0.015% | 45,132,321 | 24.3% |
[ 0.0% - 0.5% ] 0.14% | 2,793,359 | 30.4% |
[ 0.0% - 0.5% ] 0.24% | 897,369 | 28.7% |
[ 0.0% - 0.5% ] 0.34% | 464,013 | 29.8% |
[ 0.0% - 0.5% ] 0.43% | 161,467 | 28.0% |
[ 0.5% - 1.0% ] 0.57% | 64,876 | 33.4% |
[ 0.5% - 1.0% ] 0.64% | 94,825 | 32.2% |
[ 0.5% - 1.0% ] 0.74% | 111,162 | 25.8% |
[ 0.5% - 1.0% ] 0.85% | 32,353 | 39.8% |
[ 0.5% - 1.0% ] 0.96% | 6,453 | 31.1% |
[ 1.0% - 1.5% ] 1.06% | 14,002 | 35.3% |
[ 1.0% - 1.5% ] 1.15% | 40,180 | 28.4% |
[ 1.0% - 1.5% ] 1.22% | 4,181 | 26.0% |
[ 1.0% - 1.5% ] 1.37% | 28,621 | 23.3% |
[ 1.0% - 1.5% ] 1.47% | 7,800 | 46.4% |
[ 1.5% - 2.0% ] 1.58% | 17,033 | 35.2% |
[ 1.5% - 2.0% ] 1.63% | 4,663 | 18.2% |
[ 1.5% - 2.0% ] 1.84% | 7,814 | 2.3% |
[ 1.5% - 2.0% ] 1.94% | 16,072 | 9.1% |
[ 2.0% - 2.5% ] 2.05% | 1,948 | 38.2% |
[ 2.0% - 2.5% ] 2.27% | 10,284 | 30.7% |
[ 2.0% - 2.5% ] 2.50% | 6,248 | 1.6% |
[ 2.5% - 3.0% ] 2.53% | 474 | 3.7% |
[ 2.5% - 3.0% ] 2.67% | 1,274 | 16.7% |
[ 2.5% - 3.0% ] 2.83% | 636 | 6.7% |
[ 2.5% - 3.0% ] 2.93% | 5,148 | 25.1% |
[ 3.0% - 3.5% ] 3.15% | 6,894 | 25.8% |
[ 3.0% - 3.5% ] 3.35% | 1,105 | 32.5% |
[ 3.5% - 4.0% ] 3.52% | 1,991 | 18.2% |
[ 4.0% - 4.5% ] 4.10% | 390 | 3.7% |
[ 4.5% - 5.0% ] 4.56% | 351 | 31.6% |
[ 4.5% - 5.0% ] 4.76% | 4,857 | 26.5% |
[ 4.5% - 5.0% ] 4.95% | 202 | 35.1% |
[ 5.0% - 5.5% ] 5.20% | 250 | 7.6% |
[ 5.0% - 5.5% ] 5.22% | 862 | 30.3% |
[ 5.5% - 6.0% ] 5.99% | 267 | 31.8% |
[ 6.0% - 6.5% ] 6.30% | 1,031 | 12.6% |
[ 6.5% - 7.0% ] 6.93% | 1,415 | 20.0% |
[ 7.0% - 7.5% ] 7.11% | 759 | 2.8% |
[ 9.5% - 10.0% ] 9.83% | 356 | 22.0% |
[ 11.0% - 11.5% ] 11.49% | 87 | 45.3% |