Cambodian Wage/Income Gap
COMPARE
Cambodian
Select to Compare
Wage/Income Gap
Cambodian Wage/Income Gap
25.8%
WAGE/INCOME GAP
45.1/ 100
METRIC RATING
177th/ 347
METRIC RANK
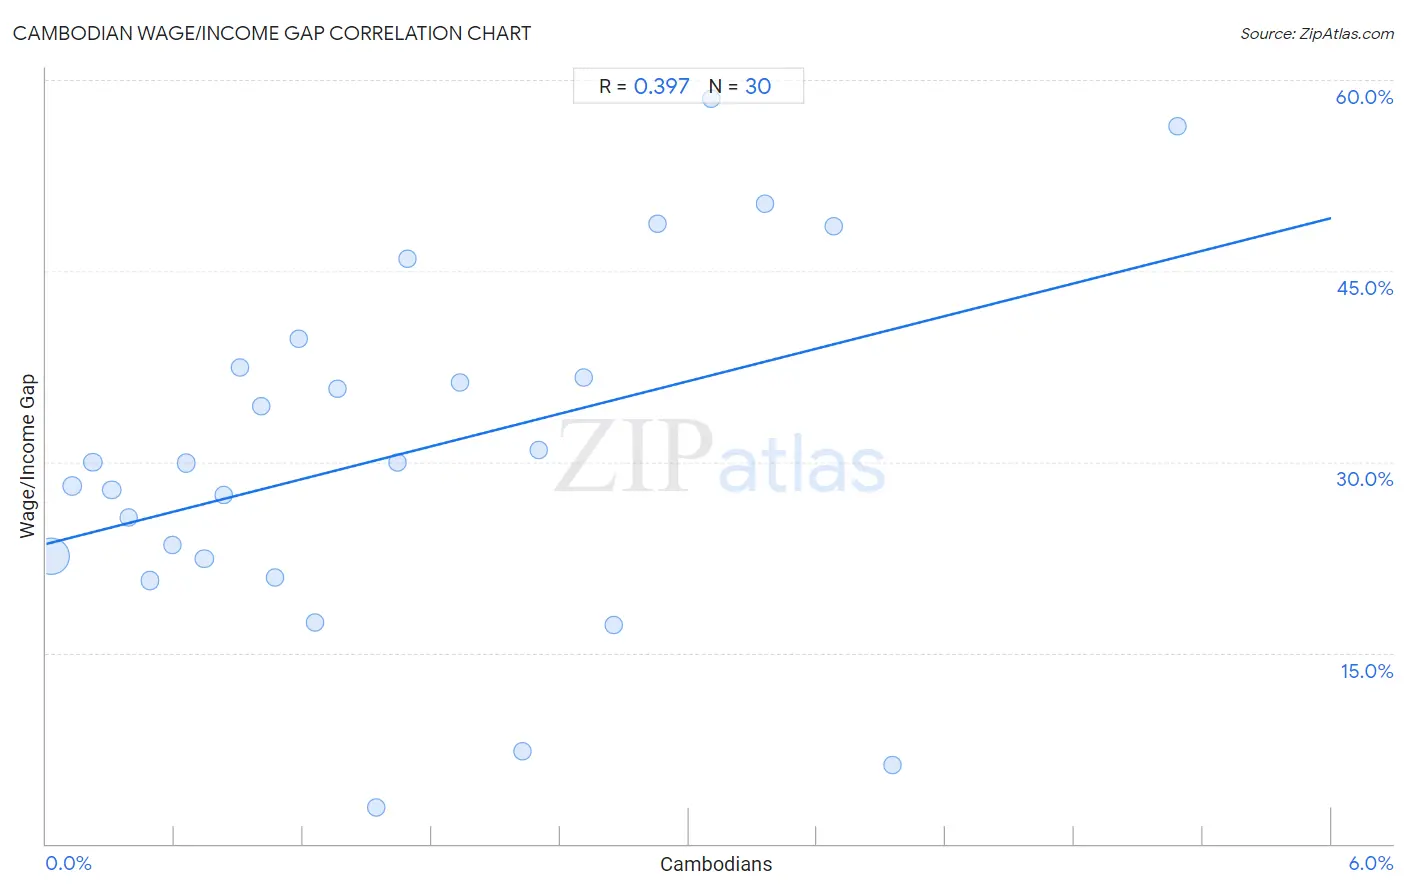
Cambodian Wage/Income Gap Correlation Chart
The statistical analysis conducted on geographies consisting of 102,500,825 people shows a mild positive correlation between the proportion of Cambodians and wage/income gap percentage in the United States with a correlation coefficient (R) of 0.397 and weighted average of 25.8%. On average, for every 1% (one percent) increase in Cambodians within a typical geography, there is an increase of 4.3% in wage/income gap percentage.
It is essential to understand that the correlation between the percentage of Cambodians and wage/income gap percentage does not imply a direct cause-and-effect relationship. It remains uncertain whether the presence of Cambodians influences an upward or downward trend in the level of wage/income gap percentage within an area, or if Cambodians simply ended up residing in those areas with higher or lower levels of wage/income gap percentage due to other factors.
Demographics Similar to Cambodians by Wage/Income Gap
In terms of wage/income gap, the demographic groups most similar to Cambodians are Paraguayan (25.8%, a difference of 0.11%), Sri Lankan (25.8%, a difference of 0.12%), Chinese (25.9%, a difference of 0.21%), Alaskan Athabascan (25.8%, a difference of 0.32%), and Samoan (26.0%, a difference of 0.44%).
| Demographics | Rating | Rank | Wage/Income Gap |
| Immigrants from Oceania | 57.5 /100 | #170 | Average 25.6% |
| Immigrants from Greece | 56.6 /100 | #171 | Average 25.7% |
| Immigrants from Chile | 53.2 /100 | #172 | Average 25.7% |
| Immigrants from Belarus | 52.9 /100 | #173 | Average 25.7% |
| Alaskan Athabascans | 50.0 /100 | #174 | Average 25.8% |
| Sri Lankans | 47.0 /100 | #175 | Average 25.8% |
| Paraguayans | 46.7 /100 | #176 | Average 25.8% |
| Cambodians | 45.1 /100 | #177 | Average 25.8% |
| Chinese | 42.0 /100 | #178 | Average 25.9% |
| Samoans | 38.6 /100 | #179 | Fair 26.0% |
| Guamanians/Chamorros | 38.0 /100 | #180 | Fair 26.0% |
| Immigrants from Bolivia | 36.4 /100 | #181 | Fair 26.0% |
| Immigrants from Serbia | 35.4 /100 | #182 | Fair 26.0% |
| Immigrants from Kazakhstan | 35.2 /100 | #183 | Fair 26.0% |
| Mexicans | 34.4 /100 | #184 | Fair 26.0% |
Cambodian Wage/Income Gap Correlation Summary
| Measurement | Cambodian Data | Wage/Income Gap Data |
| Minimum | 0.024% | 2.9% |
| Maximum | 5.3% | 58.5% |
| Range | 5.3% | 55.6% |
| Mean | 1.7% | 30.6% |
| Median | 1.3% | 29.9% |
| Interquartile 25% (IQ1) | 0.65% | 22.4% |
| Interquartile 75% (IQ3) | 2.5% | 37.4% |
| Interquartile Range (IQR) | 1.9% | 15.0% |
| Standard Deviation (Sample) | 1.3% | 13.9% |
| Standard Deviation (Population) | 1.3% | 13.7% |
Correlation Details
| Cambodian Percentile | Sample Size | Wage/Income Gap |
[ 0.0% - 0.5% ] 0.024% | 87,243,968 | 22.6% |
[ 0.0% - 0.5% ] 0.12% | 8,308,441 | 28.1% |
[ 0.0% - 0.5% ] 0.22% | 2,497,204 | 30.0% |
[ 0.0% - 0.5% ] 0.30% | 1,480,491 | 27.8% |
[ 0.0% - 0.5% ] 0.38% | 713,106 | 25.6% |
[ 0.0% - 0.5% ] 0.48% | 385,886 | 20.7% |
[ 0.5% - 1.0% ] 0.59% | 412,017 | 23.5% |
[ 0.5% - 1.0% ] 0.65% | 409,244 | 29.9% |
[ 0.5% - 1.0% ] 0.74% | 356,632 | 22.4% |
[ 0.5% - 1.0% ] 0.83% | 201,106 | 27.4% |
[ 0.5% - 1.0% ] 0.90% | 94,130 | 37.4% |
[ 1.0% - 1.5% ] 1.01% | 139,822 | 34.4% |
[ 1.0% - 1.5% ] 1.07% | 53,882 | 20.9% |
[ 1.0% - 1.5% ] 1.18% | 23,929 | 39.7% |
[ 1.0% - 1.5% ] 1.26% | 43,376 | 17.4% |
[ 1.0% - 1.5% ] 1.36% | 8,899 | 35.8% |
[ 1.5% - 2.0% ] 1.54% | 845 | 2.9% |
[ 1.5% - 2.0% ] 1.64% | 6,771 | 30.0% |
[ 1.5% - 2.0% ] 1.68% | 475 | 46.0% |
[ 1.5% - 2.0% ] 1.93% | 1,708 | 36.3% |
[ 2.0% - 2.5% ] 2.23% | 38,400 | 7.3% |
[ 2.0% - 2.5% ] 2.30% | 25,374 | 31.0% |
[ 2.5% - 3.0% ] 2.51% | 41,058 | 36.6% |
[ 2.5% - 3.0% ] 2.65% | 2,716 | 17.2% |
[ 2.5% - 3.0% ] 2.86% | 3,571 | 48.7% |
[ 3.0% - 3.5% ] 3.10% | 2,933 | 58.5% |
[ 3.0% - 3.5% ] 3.35% | 1,670 | 50.2% |
[ 3.5% - 4.0% ] 3.67% | 762 | 48.5% |
[ 3.5% - 4.0% ] 3.95% | 1,822 | 6.1% |
[ 5.0% - 5.5% ] 5.28% | 587 | 56.4% |