Seminole vs Portuguese Wage/Income Gap
COMPARE
Seminole
Portuguese
Wage/Income Gap
Wage/Income Gap Comparison
Seminole
Portuguese
25.6%
WAGE/INCOME GAP
62.6/ 100
METRIC RATING
168th/ 347
METRIC RANK
27.4%
WAGE/INCOME GAP
2.2/ 100
METRIC RATING
253rd/ 347
METRIC RANK
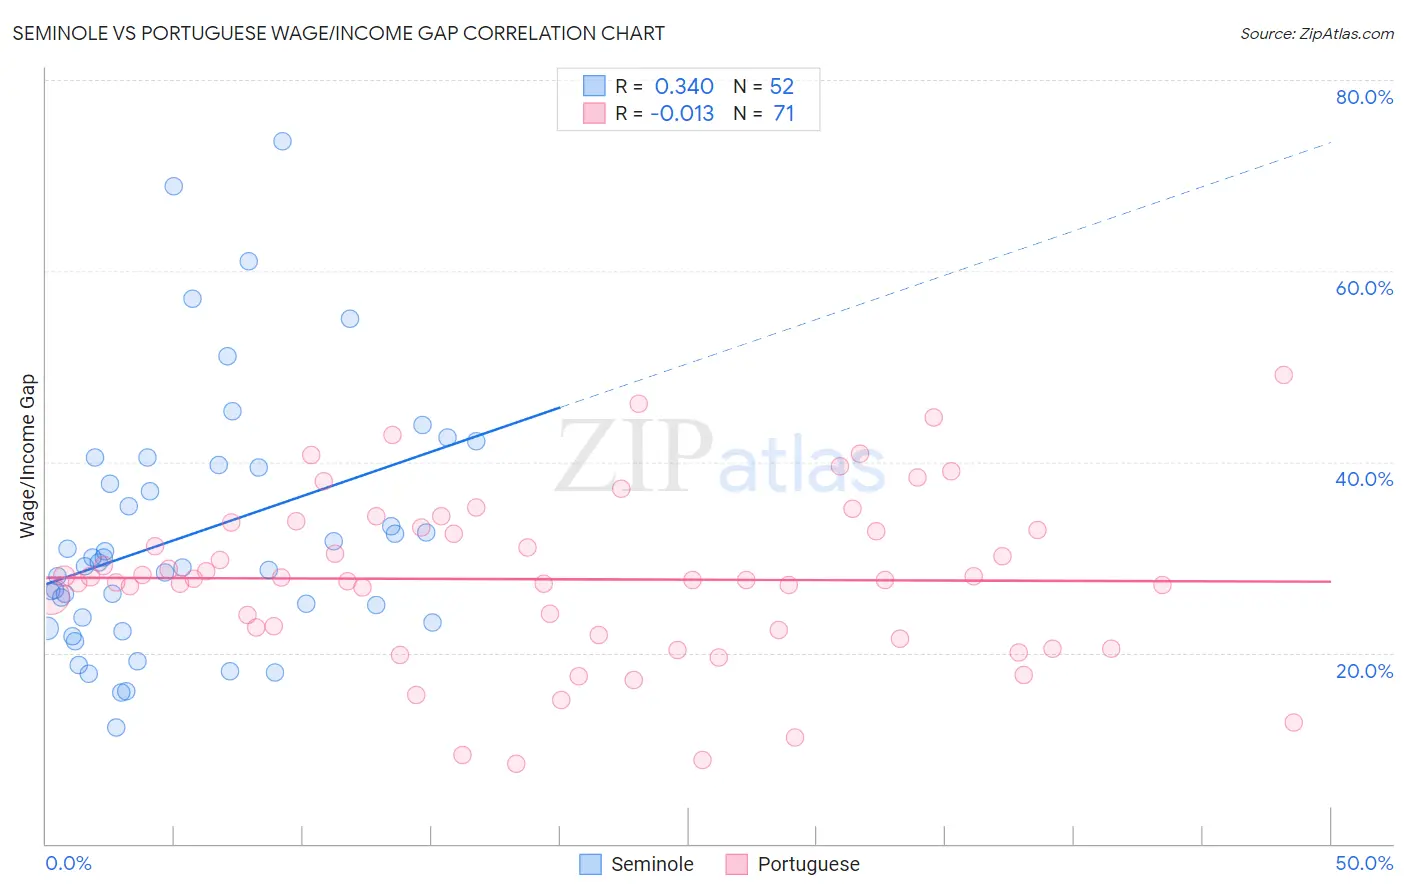
Seminole vs Portuguese Wage/Income Gap Correlation Chart
The statistical analysis conducted on geographies consisting of 118,242,273 people shows a mild positive correlation between the proportion of Seminole and wage/income gap percentage in the United States with a correlation coefficient (R) of 0.340 and weighted average of 25.6%. Similarly, the statistical analysis conducted on geographies consisting of 449,694,788 people shows no correlation between the proportion of Portuguese and wage/income gap percentage in the United States with a correlation coefficient (R) of -0.013 and weighted average of 27.4%, a difference of 7.1%.
Wage/Income Gap Correlation Summary
| Measurement | Seminole | Portuguese |
| Minimum | 12.2% | 8.3% |
| Maximum | 73.6% | 49.0% |
| Range | 61.3% | 40.7% |
| Mean | 32.4% | 27.7% |
| Median | 29.3% | 27.7% |
| Interquartile 25% (IQ1) | 23.5% | 21.8% |
| Interquartile 75% (IQ3) | 39.5% | 33.1% |
| Interquartile Range (IQR) | 16.1% | 11.3% |
| Standard Deviation (Sample) | 13.3% | 8.8% |
| Standard Deviation (Population) | 13.2% | 8.7% |
Similar Demographics by Wage/Income Gap
Demographics Similar to Seminole by Wage/Income Gap
In terms of wage/income gap, the demographic groups most similar to Seminole are Paiute (25.5%, a difference of 0.020%), Immigrants from Ukraine (25.5%, a difference of 0.080%), Immigrants from Hong Kong (25.5%, a difference of 0.090%), Peruvian (25.6%, a difference of 0.18%), and Immigrants from Oceania (25.6%, a difference of 0.35%).
| Demographics | Rating | Rank | Wage/Income Gap |
| Albanians | 69.4 /100 | #161 | Good 25.4% |
| Shoshone | 69.0 /100 | #162 | Good 25.4% |
| Native Hawaiians | 69.0 /100 | #163 | Good 25.4% |
| Koreans | 68.6 /100 | #164 | Good 25.4% |
| Immigrants | Hong Kong | 64.0 /100 | #165 | Good 25.5% |
| Immigrants | Ukraine | 63.8 /100 | #166 | Good 25.5% |
| Paiute | 62.9 /100 | #167 | Good 25.5% |
| Seminole | 62.6 /100 | #168 | Good 25.6% |
| Peruvians | 60.1 /100 | #169 | Good 25.6% |
| Immigrants | Oceania | 57.5 /100 | #170 | Average 25.6% |
| Immigrants | Greece | 56.6 /100 | #171 | Average 25.7% |
| Immigrants | Chile | 53.2 /100 | #172 | Average 25.7% |
| Immigrants | Belarus | 52.9 /100 | #173 | Average 25.7% |
| Alaskan Athabascans | 50.0 /100 | #174 | Average 25.8% |
| Sri Lankans | 47.0 /100 | #175 | Average 25.8% |
Demographics Similar to Portuguese by Wage/Income Gap
In terms of wage/income gap, the demographic groups most similar to Portuguese are Israeli (27.4%, a difference of 0.080%), Immigrants from France (27.4%, a difference of 0.090%), Ukrainian (27.3%, a difference of 0.16%), Cherokee (27.4%, a difference of 0.20%), and Immigrants from Norway (27.3%, a difference of 0.22%).
| Demographics | Rating | Rank | Wage/Income Gap |
| Immigrants | Nonimmigrants | 3.3 /100 | #246 | Tragic 27.2% |
| Celtics | 2.8 /100 | #247 | Tragic 27.3% |
| Cypriots | 2.8 /100 | #248 | Tragic 27.3% |
| Carpatho Rusyns | 2.7 /100 | #249 | Tragic 27.3% |
| Immigrants | Czechoslovakia | 2.7 /100 | #250 | Tragic 27.3% |
| Immigrants | Norway | 2.5 /100 | #251 | Tragic 27.3% |
| Ukrainians | 2.4 /100 | #252 | Tragic 27.3% |
| Portuguese | 2.2 /100 | #253 | Tragic 27.4% |
| Israelis | 2.1 /100 | #254 | Tragic 27.4% |
| Immigrants | France | 2.1 /100 | #255 | Tragic 27.4% |
| Cherokee | 1.9 /100 | #256 | Tragic 27.4% |
| Luxembourgers | 1.9 /100 | #257 | Tragic 27.4% |
| Slavs | 1.8 /100 | #258 | Tragic 27.4% |
| Icelanders | 1.8 /100 | #259 | Tragic 27.5% |
| Tongans | 1.7 /100 | #260 | Tragic 27.5% |