Immigrants from Laos Wage/Income Gap
COMPARE
Immigrants from Laos
Select to Compare
Wage/Income Gap
Immigrants from Laos Wage/Income Gap
23.8%
WAGE/INCOME GAP
99.0/ 100
METRIC RATING
102nd/ 347
METRIC RANK
Immigrants from Laos Wage/Income Gap Correlation Chart
The statistical analysis conducted on geographies consisting of 201,434,388 people shows a weak positive correlation between the proportion of Immigrants from Laos and wage/income gap percentage in the United States with a correlation coefficient (R) of 0.234 and weighted average of 23.8%. On average, for every 1% (one percent) increase in Immigrants from Laos within a typical geography, there is an increase of 0.90% in wage/income gap percentage.
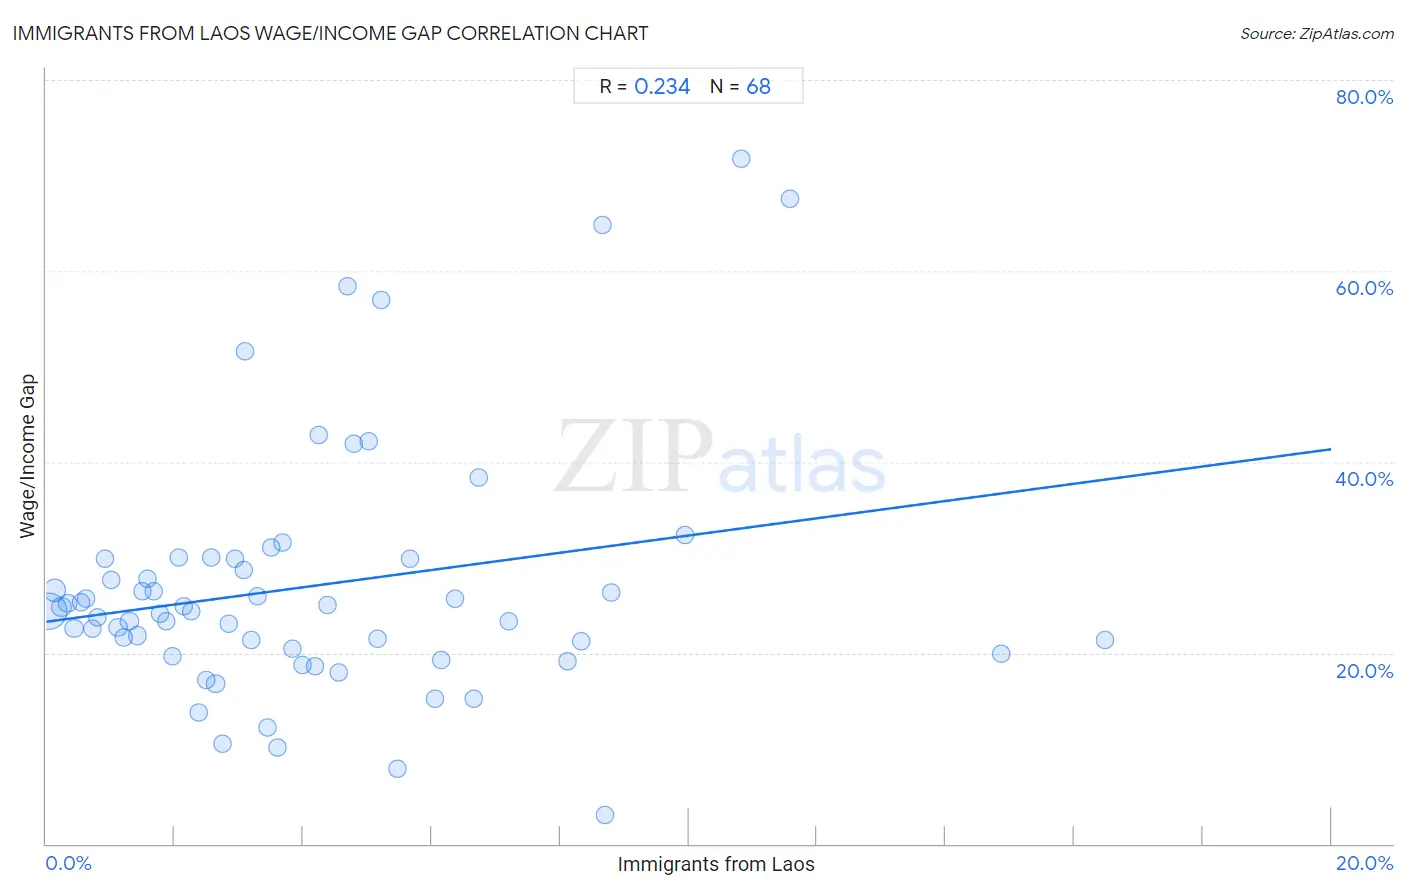
It is essential to understand that the correlation between the percentage of Immigrants from Laos and wage/income gap percentage does not imply a direct cause-and-effect relationship. It remains uncertain whether the presence of Immigrants from Laos influences an upward or downward trend in the level of wage/income gap percentage within an area, or if Immigrants from Laos simply ended up residing in those areas with higher or lower levels of wage/income gap percentage due to other factors.
Demographics Similar to Immigrants from Laos by Wage/Income Gap
In terms of wage/income gap, the demographic groups most similar to Immigrants from Laos are Japanese (23.8%, a difference of 0.14%), Tsimshian (23.9%, a difference of 0.23%), Yakama (23.7%, a difference of 0.30%), Aleut (23.7%, a difference of 0.32%), and Immigrants from Latin America (23.7%, a difference of 0.39%).
| Demographics | Rating | Rank | Wage/Income Gap |
| Cape Verdeans | 99.4 /100 | #95 | Exceptional 23.6% |
| Kiowa | 99.4 /100 | #96 | Exceptional 23.6% |
| Immigrants from Sudan | 99.4 /100 | #97 | Exceptional 23.6% |
| Immigrants from Latin America | 99.2 /100 | #98 | Exceptional 23.7% |
| Aleuts | 99.2 /100 | #99 | Exceptional 23.7% |
| Yakama | 99.2 /100 | #100 | Exceptional 23.7% |
| Japanese | 99.1 /100 | #101 | Exceptional 23.8% |
| Immigrants from Laos | 99.0 /100 | #102 | Exceptional 23.8% |
| Tsimshian | 98.9 /100 | #103 | Exceptional 23.9% |
| Tlingit-Haida | 98.7 /100 | #104 | Exceptional 24.0% |
| Moroccans | 98.6 /100 | #105 | Exceptional 24.0% |
| Sudanese | 98.6 /100 | #106 | Exceptional 24.0% |
| Yaqui | 98.4 /100 | #107 | Exceptional 24.0% |
| Immigrants from Albania | 98.4 /100 | #108 | Exceptional 24.0% |
| Ugandans | 98.3 /100 | #109 | Exceptional 24.1% |
Immigrants from Laos Wage/Income Gap Correlation Summary
| Measurement | Immigrants from Laos Data | Wage/Income Gap Data |
| Minimum | 0.032% | 3.0% |
| Maximum | 16.5% | 71.7% |
| Range | 16.5% | 68.7% |
| Mean | 4.1% | 27.0% |
| Median | 3.2% | 24.4% |
| Interquartile 25% (IQ1) | 1.6% | 20.2% |
| Interquartile 75% (IQ3) | 5.6% | 29.8% |
| Interquartile Range (IQR) | 3.9% | 9.7% |
| Standard Deviation (Sample) | 3.4% | 13.2% |
| Standard Deviation (Population) | 3.4% | 13.1% |
Correlation Details
| Immigrants from Laos Percentile | Sample Size | Wage/Income Gap |
[ 0.0% - 0.5% ] 0.032% | 130,097,805 | 24.4% |
[ 0.0% - 0.5% ] 0.13% | 30,162,761 | 26.6% |
[ 0.0% - 0.5% ] 0.23% | 14,852,098 | 24.8% |
[ 0.0% - 0.5% ] 0.33% | 7,159,200 | 25.2% |
[ 0.0% - 0.5% ] 0.43% | 4,161,756 | 22.5% |
[ 0.5% - 1.0% ] 0.54% | 2,766,930 | 25.3% |
[ 0.5% - 1.0% ] 0.62% | 2,712,471 | 25.6% |
[ 0.5% - 1.0% ] 0.72% | 1,289,060 | 22.5% |
[ 0.5% - 1.0% ] 0.80% | 1,256,502 | 23.7% |
[ 0.5% - 1.0% ] 0.91% | 832,024 | 29.9% |
[ 1.0% - 1.5% ] 1.01% | 449,931 | 27.6% |
[ 1.0% - 1.5% ] 1.12% | 1,199,504 | 22.7% |
[ 1.0% - 1.5% ] 1.20% | 547,455 | 21.6% |
[ 1.0% - 1.5% ] 1.29% | 394,847 | 23.3% |
[ 1.0% - 1.5% ] 1.41% | 1,112,812 | 21.8% |
[ 1.5% - 2.0% ] 1.50% | 107,002 | 26.5% |
[ 1.5% - 2.0% ] 1.58% | 100,924 | 27.7% |
[ 1.5% - 2.0% ] 1.68% | 177,331 | 26.4% |
[ 1.5% - 2.0% ] 1.78% | 183,110 | 24.0% |
[ 1.5% - 2.0% ] 1.87% | 139,414 | 23.3% |
[ 1.5% - 2.0% ] 1.97% | 261,606 | 19.7% |
[ 2.0% - 2.5% ] 2.07% | 66,031 | 29.9% |
[ 2.0% - 2.5% ] 2.15% | 67,210 | 24.8% |
[ 2.0% - 2.5% ] 2.25% | 77,659 | 24.4% |
[ 2.0% - 2.5% ] 2.38% | 72,249 | 13.7% |
[ 2.0% - 2.5% ] 2.48% | 68,155 | 17.1% |
[ 2.5% - 3.0% ] 2.57% | 63,958 | 30.0% |
[ 2.5% - 3.0% ] 2.64% | 336,095 | 16.8% |
[ 2.5% - 3.0% ] 2.74% | 56,927 | 10.5% |
[ 2.5% - 3.0% ] 2.83% | 77,547 | 23.0% |
[ 2.5% - 3.0% ] 2.94% | 8,566 | 29.8% |
[ 3.0% - 3.5% ] 3.07% | 32,651 | 28.7% |
[ 3.0% - 3.5% ] 3.10% | 258 | 51.6% |
[ 3.0% - 3.5% ] 3.20% | 92,651 | 21.3% |
[ 3.0% - 3.5% ] 3.29% | 4,530 | 25.9% |
[ 3.0% - 3.5% ] 3.45% | 8,517 | 12.2% |
[ 3.0% - 3.5% ] 3.49% | 2,433 | 31.0% |
[ 3.5% - 4.0% ] 3.60% | 70,364 | 10.1% |
[ 3.5% - 4.0% ] 3.68% | 789 | 31.6% |
[ 3.5% - 4.0% ] 3.84% | 41,405 | 20.4% |
[ 3.5% - 4.0% ] 3.99% | 145,910 | 18.8% |
[ 4.0% - 4.5% ] 4.18% | 34,220 | 18.6% |
[ 4.0% - 4.5% ] 4.24% | 802 | 42.8% |
[ 4.0% - 4.5% ] 4.38% | 958 | 25.1% |
[ 4.5% - 5.0% ] 4.55% | 14,787 | 17.9% |
[ 4.5% - 5.0% ] 4.69% | 2,984 | 58.5% |
[ 4.5% - 5.0% ] 4.79% | 1,003 | 42.0% |
[ 5.0% - 5.5% ] 5.03% | 5,134 | 42.1% |
[ 5.0% - 5.5% ] 5.15% | 4,332 | 21.5% |
[ 5.0% - 5.5% ] 5.21% | 326 | 56.9% |
[ 5.0% - 5.5% ] 5.47% | 17,716 | 7.8% |
[ 5.5% - 6.0% ] 5.66% | 106 | 29.9% |
[ 6.0% - 6.5% ] 6.06% | 57,662 | 15.2% |
[ 6.0% - 6.5% ] 6.16% | 991 | 19.2% |
[ 6.0% - 6.5% ] 6.36% | 3,208 | 25.6% |
[ 6.5% - 7.0% ] 6.65% | 19,613 | 15.2% |
[ 6.5% - 7.0% ] 6.74% | 1,900 | 38.4% |
[ 7.0% - 7.5% ] 7.19% | 153 | 23.3% |
[ 8.0% - 8.5% ] 8.11% | 2,207 | 19.1% |
[ 8.0% - 8.5% ] 8.33% | 216 | 21.3% |
[ 8.5% - 9.0% ] 8.65% | 1,052 | 64.8% |
[ 8.5% - 9.0% ] 8.70% | 1,172 | 3.0% |
[ 8.5% - 9.0% ] 8.80% | 1,693 | 26.3% |
[ 9.5% - 10.0% ] 9.93% | 1,218 | 32.3% |
[ 10.5% - 11.0% ] 10.82% | 564 | 71.7% |
[ 11.5% - 12.0% ] 11.58% | 570 | 67.5% |
[ 14.5% - 15.0% ] 14.86% | 619 | 19.9% |
[ 16.0% - 16.5% ] 16.49% | 734 | 21.4% |