Immigrants from Zimbabwe Wage/Income Gap
COMPARE
Immigrants from Zimbabwe
Select to Compare
Wage/Income Gap
Immigrants from Zimbabwe Wage/Income Gap
25.3%
WAGE/INCOME GAP
73.7/ 100
METRIC RATING
158th/ 347
METRIC RANK
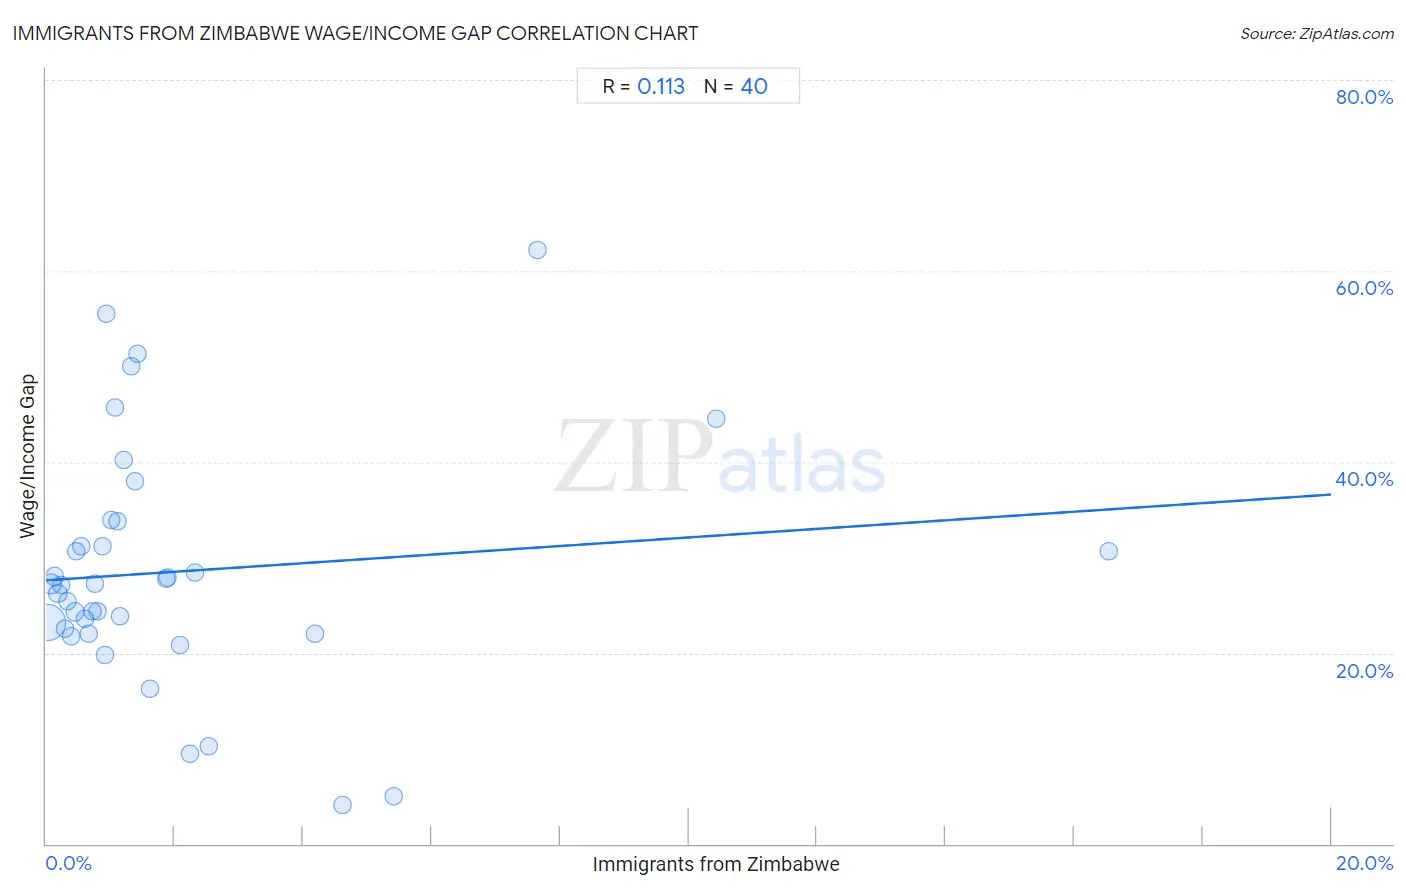
Immigrants from Zimbabwe Wage/Income Gap Correlation Chart
The statistical analysis conducted on geographies consisting of 117,792,332 people shows a poor positive correlation between the proportion of Immigrants from Zimbabwe and wage/income gap percentage in the United States with a correlation coefficient (R) of 0.113 and weighted average of 25.3%. On average, for every 1% (one percent) increase in Immigrants from Zimbabwe within a typical geography, there is an increase of 0.45% in wage/income gap percentage.
It is essential to understand that the correlation between the percentage of Immigrants from Zimbabwe and wage/income gap percentage does not imply a direct cause-and-effect relationship. It remains uncertain whether the presence of Immigrants from Zimbabwe influences an upward or downward trend in the level of wage/income gap percentage within an area, or if Immigrants from Zimbabwe simply ended up residing in those areas with higher or lower levels of wage/income gap percentage due to other factors.
Demographics Similar to Immigrants from Zimbabwe by Wage/Income Gap
In terms of wage/income gap, the demographic groups most similar to Immigrants from Zimbabwe are Puget Sound Salish (25.3%, a difference of 0.060%), French American Indian (25.4%, a difference of 0.10%), Costa Rican (25.3%, a difference of 0.18%), Immigrants from Mexico (25.3%, a difference of 0.24%), and Albanian (25.4%, a difference of 0.35%).
| Demographics | Rating | Rank | Wage/Income Gap |
| Taiwanese | 81.6 /100 | #151 | Excellent 25.1% |
| Uruguayans | 81.3 /100 | #152 | Excellent 25.2% |
| Blackfeet | 78.1 /100 | #153 | Good 25.2% |
| Immigrants from Northern Africa | 78.1 /100 | #154 | Good 25.2% |
| Immigrants from Vietnam | 77.7 /100 | #155 | Good 25.2% |
| Immigrants from Mexico | 76.4 /100 | #156 | Good 25.3% |
| Costa Ricans | 75.8 /100 | #157 | Good 25.3% |
| Immigrants from Zimbabwe | 73.7 /100 | #158 | Good 25.3% |
| Puget Sound Salish | 73.0 /100 | #159 | Good 25.3% |
| French American Indians | 72.5 /100 | #160 | Good 25.4% |
| Albanians | 69.4 /100 | #161 | Good 25.4% |
| Shoshone | 69.0 /100 | #162 | Good 25.4% |
| Native Hawaiians | 69.0 /100 | #163 | Good 25.4% |
| Koreans | 68.6 /100 | #164 | Good 25.4% |
| Immigrants from Hong Kong | 64.0 /100 | #165 | Good 25.5% |
Immigrants from Zimbabwe Wage/Income Gap Correlation Summary
| Measurement | Immigrants from Zimbabwe Data | Wage/Income Gap Data |
| Minimum | 0.017% | 4.0% |
| Maximum | 16.5% | 62.1% |
| Range | 16.5% | 58.1% |
| Mean | 2.1% | 28.5% |
| Median | 1.0% | 27.1% |
| Interquartile 25% (IQ1) | 0.51% | 22.3% |
| Interquartile 75% (IQ3) | 2.0% | 32.5% |
| Interquartile Range (IQR) | 1.5% | 10.2% |
| Standard Deviation (Sample) | 3.2% | 12.6% |
| Standard Deviation (Population) | 3.1% | 12.4% |
Correlation Details
| Immigrants from Zimbabwe Percentile | Sample Size | Wage/Income Gap |
[ 0.0% - 0.5% ] 0.017% | 96,588,556 | 23.2% |
[ 0.0% - 0.5% ] 0.074% | 11,551,653 | 27.2% |
[ 0.0% - 0.5% ] 0.13% | 3,963,406 | 28.0% |
[ 0.0% - 0.5% ] 0.18% | 2,089,314 | 26.2% |
[ 0.0% - 0.5% ] 0.23% | 885,379 | 27.1% |
[ 0.0% - 0.5% ] 0.29% | 669,440 | 22.6% |
[ 0.0% - 0.5% ] 0.33% | 478,711 | 25.4% |
[ 0.0% - 0.5% ] 0.39% | 334,661 | 21.7% |
[ 0.0% - 0.5% ] 0.45% | 355,667 | 24.3% |
[ 0.0% - 0.5% ] 0.48% | 94,478 | 30.7% |
[ 0.5% - 1.0% ] 0.55% | 234,359 | 31.1% |
[ 0.5% - 1.0% ] 0.61% | 83,805 | 23.5% |
[ 0.5% - 1.0% ] 0.66% | 42,362 | 22.0% |
[ 0.5% - 1.0% ] 0.71% | 39,523 | 24.3% |
[ 0.5% - 1.0% ] 0.77% | 76,206 | 27.2% |
[ 0.5% - 1.0% ] 0.79% | 52,753 | 24.3% |
[ 0.5% - 1.0% ] 0.88% | 13,719 | 31.2% |
[ 0.5% - 1.0% ] 0.91% | 58,877 | 19.7% |
[ 0.5% - 1.0% ] 0.94% | 3,935 | 55.5% |
[ 1.0% - 1.5% ] 1.02% | 32,114 | 33.9% |
[ 1.0% - 1.5% ] 1.06% | 4,790 | 45.6% |
[ 1.0% - 1.5% ] 1.11% | 29,419 | 33.7% |
[ 1.0% - 1.5% ] 1.16% | 4,413 | 23.8% |
[ 1.0% - 1.5% ] 1.20% | 916 | 40.2% |
[ 1.0% - 1.5% ] 1.33% | 18,115 | 50.1% |
[ 1.0% - 1.5% ] 1.38% | 4,483 | 38.0% |
[ 1.0% - 1.5% ] 1.43% | 3,572 | 51.3% |
[ 1.5% - 2.0% ] 1.62% | 26,607 | 16.2% |
[ 1.5% - 2.0% ] 1.87% | 428 | 27.7% |
[ 1.5% - 2.0% ] 1.88% | 1,221 | 27.9% |
[ 2.0% - 2.5% ] 2.08% | 3,801 | 20.8% |
[ 2.0% - 2.5% ] 2.23% | 20,716 | 9.4% |
[ 2.0% - 2.5% ] 2.32% | 18,077 | 28.4% |
[ 2.5% - 3.0% ] 2.54% | 197 | 10.2% |
[ 4.0% - 4.5% ] 4.19% | 2,961 | 22.0% |
[ 4.5% - 5.0% ] 4.62% | 1,473 | 4.0% |
[ 5.0% - 5.5% ] 5.42% | 1,366 | 5.0% |
[ 7.5% - 8.0% ] 7.64% | 419 | 62.1% |
[ 10.0% - 10.5% ] 10.42% | 307 | 44.5% |
[ 16.5% - 17.0% ] 16.54% | 133 | 30.6% |