Trinidadian and Tobagonian Wage/Income Gap

COMPARE

Trinidadian and Tobagonian
Race
Ancestry
AfghanAfricanAlaska NativeAlaskan AthabascanAlbanianAleutAlsatianAmericanApacheArabArapahoArgentineanArmenianAssyrian/Chaldean/SyriacAustralianAustrianBahamianBangladeshiBarbadianBasqueBelgianBelizeanBermudanBhutaneseBlackfeetBolivianBrazilianBritishBritish West IndianBulgarianBurmeseCajunCambodianCanadianCape VerdeanCarpatho RusynCelticCentral AmericanCentral American IndianCherokeeCheyenneChickasawChileanChineseChippewaChoctawColombianColvilleComancheCosta RicanCreeCreekCroatianCrowCubanCypriotCzechCzechoslovakianDanishDelawareDominicanDutchDutch West IndianEastern EuropeanEcuadorianEgyptianEnglishEstonianEthiopianEuropeanFijianFilipinoFinnishFrenchFrench American IndianFrench CanadianGermanGerman RussianGhanaianGreekGuamanian/ChamorroGuatemalanGuyaneseHaitianHmongHonduranHopiHoumaHungarianIcelanderIndian (Asian)IndonesianInupiatIranianIraqiIrishIroquoisIsraeliItalianJamaicanJapaneseJordanianKenyanKiowaKoreanLaotianLatvianLebaneseLiberianLithuanianLumbeeLuxembourgerMacedonianMalaysianMalteseMarshalleseMenomineeMexicanMexican American IndianMongolianMoroccanNative HawaiianNavajoNepaleseNew ZealanderNicaraguanNigerianNorthern EuropeanNorwegianOkinawanOsageOttawaPaiutePakistaniPalestinianPanamanianParaguayanPennsylvania GermanPeruvianPimaPolishPortuguesePotawatomiPuebloPuerto RicanPuget Sound SalishRomanianRussianSalvadoranSamoanScandinavianScotch-IrishScottishSeminoleSenegaleseSerbianShoshoneSierra LeoneanSiouxSlavicSlovakSloveneSomaliSouth AfricanSouth AmericanSouth American IndianSoviet UnionSpaniardSpanishSpanish AmericanSpanish American IndianSri LankanSubsaharan AfricanSudaneseSwedishSwissSyrianTaiwaneseThaiTlingit-HaidaTohono O'OdhamTonganTrinidadian and TobagonianTsimshianTurkishU.S. Virgin IslanderUgandanUkrainianUruguayanUteVenezuelanVietnameseWelshWest IndianYakamaYaquiYugoslavianYumanYup'ikZimbabwean
Immigration
NonimmigrantsImmigrantsAfghanistanAfricaAlbaniaArgentinaArmeniaAsiaAustraliaAustriaBahamasBangladeshBarbadosBelarusBelgiumBelizeBoliviaBosnia and HerzegovinaBrazilBulgariaBurma/MyanmarCabo VerdeCambodiaCameroonCanadaCaribbeanCentral AmericaChileChinaColombiaCongoCosta RicaCroatiaCubaCzechoslovakiaDenmarkDominicaDominican RepublicEastern AfricaEastern AsiaEastern EuropeEcuadorEgyptEl SalvadorEnglandEritreaEthiopiaEuropeFijiFranceGermanyGhanaGreeceGrenadaGuatemalaGuyanaHaitiHondurasHong KongHungaryIndiaIndonesiaIranIraqIrelandIsraelItalyJamaicaJapanJordanKazakhstanKenyaKoreaKuwaitLaosLatin AmericaLatviaLebanonLiberiaLithuaniaMalaysiaMexicoMicronesiaMiddle AfricaMoldovaMoroccoNepalNetherlandsNicaraguaNigeriaNorth AmericaNorth MacedoniaNorthern AfricaNorthern EuropeNorwayOceaniaPakistanPanamaPeruPhilippinesPolandPortugalRomaniaRussiaSaudi ArabiaScotlandSenegalSerbiaSierra LeoneSingaporeSomaliaSouth AfricaSouth AmericaSouth Central AsiaSouth Eastern AsiaSouthern EuropeSpainSri LankaSt. Vincent and the GrenadinesSudanSwedenSwitzerlandSyriaTaiwanThailandTrinidad and TobagoTurkeyUgandaUkraineUruguayUzbekistanVenezuelaVietnamWest IndiesWestern AfricaWestern AsiaWestern EuropeYemenZaireZimbabweAzores
Select to Compare
Race
Ancestry
AfghanAfricanAlaska NativeAlaskan AthabascanAlbanianAleutAlsatianAmericanApacheArabArapahoArgentineanArmenianAssyrian/Chaldean/SyriacAustralianAustrianBahamianBangladeshiBarbadianBasqueBelgianBelizeanBermudanBhutaneseBlackfeetBolivianBrazilianBritishBritish West IndianBulgarianBurmeseCajunCambodianCanadianCape VerdeanCarpatho RusynCelticCentral AmericanCentral American IndianCherokeeCheyenneChickasawChileanChineseChippewaChoctawColombianColvilleComancheCosta RicanCreeCreekCroatianCrowCubanCypriotCzechCzechoslovakianDanishDelawareDominicanDutchDutch West IndianEastern EuropeanEcuadorianEgyptianEnglishEstonianEthiopianEuropeanFijianFilipinoFinnishFrenchFrench American IndianFrench CanadianGermanGerman RussianGhanaianGreekGuamanian/ChamorroGuatemalanGuyaneseHaitianHmongHonduranHopiHoumaHungarianIcelanderIndian (Asian)IndonesianInupiatIranianIraqiIrishIroquoisIsraeliItalianJamaicanJapaneseJordanianKenyanKiowaKoreanLaotianLatvianLebaneseLiberianLithuanianLumbeeLuxembourgerMacedonianMalaysianMalteseMarshalleseMenomineeMexicanMexican American IndianMongolianMoroccanNative HawaiianNavajoNepaleseNew ZealanderNicaraguanNigerianNorthern EuropeanNorwegianOkinawanOsageOttawaPaiutePakistaniPalestinianPanamanianParaguayanPennsylvania GermanPeruvianPimaPolishPortuguesePotawatomiPuebloPuerto RicanPuget Sound SalishRomanianRussianSalvadoranSamoanScandinavianScotch-IrishScottishSeminoleSenegaleseSerbianShoshoneSierra LeoneanSiouxSlavicSlovakSloveneSomaliSouth AfricanSouth AmericanSouth American IndianSoviet UnionSpaniardSpanishSpanish AmericanSpanish American IndianSri LankanSubsaharan AfricanSudaneseSwedishSwissSyrianTaiwaneseThaiTlingit-HaidaTohono O'OdhamTonganTsimshianTurkishU.S. Virgin IslanderUgandanUkrainianUruguayanUteVenezuelanVietnameseWelshWest IndianYakamaYaquiYugoslavianYumanYup'ikZimbabwean
Immigration
NonimmigrantsImmigrantsAfghanistanAfricaAlbaniaArgentinaArmeniaAsiaAustraliaAustriaBahamasBangladeshBarbadosBelarusBelgiumBelizeBoliviaBosnia and HerzegovinaBrazilBulgariaBurma/MyanmarCabo VerdeCambodiaCameroonCanadaCaribbeanCentral AmericaChileChinaColombiaCongoCosta RicaCroatiaCubaCzechoslovakiaDenmarkDominicaDominican RepublicEastern AfricaEastern AsiaEastern EuropeEcuadorEgyptEl SalvadorEnglandEritreaEthiopiaEuropeFijiFranceGermanyGhanaGreeceGrenadaGuatemalaGuyanaHaitiHondurasHong KongHungaryIndiaIndonesiaIranIraqIrelandIsraelItalyJamaicaJapanJordanKazakhstanKenyaKoreaKuwaitLaosLatin AmericaLatviaLebanonLiberiaLithuaniaMalaysiaMexicoMicronesiaMiddle AfricaMoldovaMoroccoNepalNetherlandsNicaraguaNigeriaNorth AmericaNorth MacedoniaNorthern AfricaNorthern EuropeNorwayOceaniaPakistanPanamaPeruPhilippinesPolandPortugalRomaniaRussiaSaudi ArabiaScotlandSenegalSerbiaSierra LeoneSingaporeSomaliaSouth AfricaSouth AmericaSouth Central AsiaSouth Eastern AsiaSouthern EuropeSpainSri LankaSt. Vincent and the GrenadinesSudanSwedenSwitzerlandSyriaTaiwanThailandTrinidad and TobagoTurkeyUgandaUkraineUruguayUzbekistanVenezuelaVietnamWest IndiesWestern AfricaWestern AsiaWestern EuropeYemenZaireZimbabweAzores
Wage/Income Gap
Income
Poverty
Unemployment
Labor Participation
Family Structure
Vehicle Availability
Education Level
Disability

Trinidadian and Tobagonian Wage/Income Gap
Exceptional

19.3%
WAGE/INCOME GAP
100.0/ 100
METRIC RATING
13th/ 347
METRIC RANK

Trinidadian and Tobagonian Wage/Income Gap Correlation Chart

The statistical analysis conducted on geographies consisting of 219,803,176 people shows a weak negative correlation between the proportion of Trinidadians and Tobagonians and wage/income gap percentage in the United States with a correlation coefficient (R) of -0.206 and weighted average of 19.3%. On average, for every 1% (one percent) increase in Trinidadians and Tobagonians within a typical geography, there is a decrease of 0.37% in wage/income gap percentage.
Trinidadian and Tobagonian Wage/Income Gap
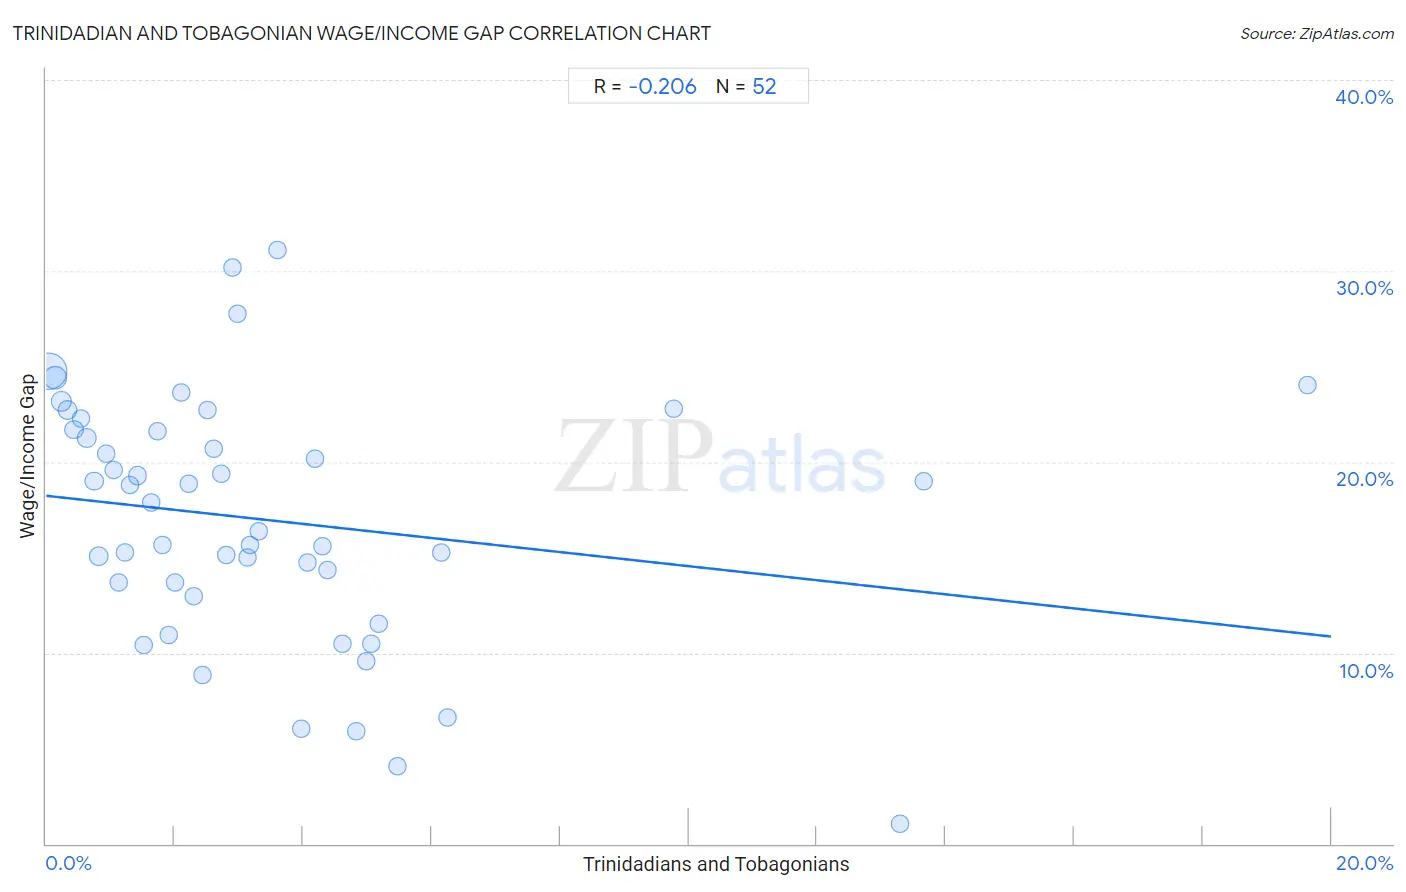
It is essential to understand that the correlation between the percentage of Trinidadians and Tobagonians and wage/income gap percentage does not imply a direct cause-and-effect relationship. It remains uncertain whether the presence of Trinidadians and Tobagonians influences an upward or downward trend in the level of wage/income gap percentage within an area, or if Trinidadians and Tobagonians simply ended up residing in those areas with higher or lower levels of wage/income gap percentage due to other factors.

Demographics Similar to Trinidadians and Tobagonians by Wage/Income Gap

In terms of wage/income gap, the demographic groups most similar to Trinidadians and Tobagonians are Immigrants from Trinidad and Tobago (19.3%, a difference of 0.050%), Immigrants from West Indies (19.2%, a difference of 0.48%), Immigrants from Haiti (19.2%, a difference of 0.59%), West Indian (19.6%, a difference of 1.2%), and Jamaican (19.6%, a difference of 1.4%).
DemographicsRating | RankWage/Income Gap
Immigrants from Guyana
100.0
/100
|
#6
Exceptional
18.4%
Puerto Ricans
100.0
/100
|
#7
Exceptional
18.7%
Immigrants from Jamaica
100.0
/100
|
#8
Exceptional
18.8%
Barbadians
100.0
/100
|
#9
Exceptional
19.0%
Crow
100.0
/100
|
#10
Exceptional
19.1%
Immigrants from Haiti
100.0
/100
|
#11
Exceptional
19.2%
Immigrants from West Indies
100.0
/100
|
#12
Exceptional
19.2%
Trinidadians and Tobagonians
100.0
/100
|
#13
Exceptional
19.3%
Immigrants from Trinidad and Tobago
100.0
/100
|
#14
Exceptional
19.3%
West Indians
100.0
/100
|
#15
Exceptional
19.6%
Jamaicans
100.0
/100
|
#16
Exceptional
19.6%
Haitians
100.0
/100
|
#17
Exceptional
19.7%
Hopi
100.0
/100
|
#18
Exceptional
20.0%
Immigrants from Dominica
100.0
/100
|
#19
Exceptional
20.0%
Bahamians
100.0
/100
|
#20
Exceptional
20.2%

Trinidadian and Tobagonian Wage/Income Gap Correlation Summary

MeasurementTrinidadian and Tobagonian DataWage/Income Gap Data
Minimum0.036%1.0%
Maximum19.6%31.1%
Range19.6%30.1%
Mean3.5%16.9%
Median2.6%17.1%
Interquartile 25% (IQ1)1.3%13.3%
Interquartile 75% (IQ3)4.3%21.6%
Interquartile Range (IQR)3.1%8.3%
Standard Deviation (Sample)3.6%6.5%
Standard Deviation (Population)3.6%6.4%

Correlation Details

Trinidadian and Tobagonian PercentileSample SizeWage/Income Gap
[
0.0%
-
0.5%
]
0.036%
132,835,76224.7%
[
0.0%
-
0.5%
]
0.14%
32,311,40324.4%
[
0.0%
-
0.5%
]
0.23%
16,466,13923.2%
[
0.0%
-
0.5%
]
0.34%
8,738,77822.7%
[
0.0%
-
0.5%
]
0.44%
5,117,71221.7%
[
0.5%
-
1.0%
]
0.54%
3,230,43622.3%
[
0.5%
-
1.0%
]
0.63%
2,424,43621.3%
[
0.5%
-
1.0%
]
0.75%
2,124,59619.0%
[
0.5%
-
1.0%
]
0.82%
9,465,36715.0%
[
0.5%
-
1.0%
]
0.93%
864,86720.4%
[
1.0%
-
1.5%
]
1.05%
708,67319.6%
[
1.0%
-
1.5%
]
1.13%
879,81213.7%
[
1.0%
-
1.5%
]
1.23%
849,12715.3%
[
1.0%
-
1.5%
]
1.31%
505,21618.8%
[
1.0%
-
1.5%
]
1.43%
529,64719.3%
[
1.5%
-
2.0%
]
1.51%
230,22610.4%
[
1.5%
-
2.0%
]
1.63%
209,49817.9%
[
1.5%
-
2.0%
]
1.73%
214,26421.6%
[
1.5%
-
2.0%
]
1.82%
217,77415.6%
[
1.5%
-
2.0%
]
1.91%
176,40210.9%
[
2.0%
-
2.5%
]
2.01%
113,27013.7%
[
2.0%
-
2.5%
]
2.09%
76,30123.6%
[
2.0%
-
2.5%
]
2.22%
49,43518.8%
[
2.0%
-
2.5%
]
2.30%
213,89813.0%
[
2.0%
-
2.5%
]
2.43%
119,1058.8%
[
2.5%
-
3.0%
]
2.52%
105,64122.7%
[
2.5%
-
3.0%
]
2.61%
18,75520.7%
[
2.5%
-
3.0%
]
2.73%
41,79719.4%
[
2.5%
-
3.0%
]
2.81%
26,54715.1%
[
2.5%
-
3.0%
]
2.90%
63,90430.2%
[
2.5%
-
3.0%
]
2.97%
1,64927.7%
[
3.0%
-
3.5%
]
3.12%
3,04215.0%
[
3.0%
-
3.5%
]
3.17%
28,60615.6%
[
3.0%
-
3.5%
]
3.31%
74,74116.3%
[
3.5%
-
4.0%
]
3.61%
8,26031.1%
[
3.5%
-
4.0%
]
3.97%
57,1926.0%
[
4.0%
-
4.5%
]
4.07%
87,69814.7%
[
4.0%
-
4.5%
]
4.17%
10,49520.2%
[
4.0%
-
4.5%
]
4.30%
7,95315.6%
[
4.0%
-
4.5%
]
4.38%
150,38714.3%
[
4.5%
-
5.0%
]
4.62%
101,05310.5%
[
4.5%
-
5.0%
]
4.83%
101,3295.9%
[
4.5%
-
5.0%
]
4.98%
51,1539.5%
[
5.0%
-
5.5%
]
5.05%
66,26210.5%
[
5.0%
-
5.5%
]
5.17%
6,85111.5%
[
5.0%
-
5.5%
]
5.47%
78,5064.0%
[
6.0%
-
6.5%
]
6.14%
29,82015.3%
[
6.0%
-
6.5%
]
6.24%
2,3226.6%
[
9.5%
-
10.0%
]
9.77%
1,17722.7%
[
13.0%
-
13.5%
]
13.29%
2,9801.0%
[
13.5%
-
14.0%
]
13.66%
68119.0%
[
19.5%
-
20.0%
]
19.63%
2,23124.0%