Cheyenne Wage/Income Gap

COMPARE

Cheyenne
Race
Ancestry
AfghanAfricanAlaska NativeAlaskan AthabascanAlbanianAleutAlsatianAmericanApacheArabArapahoArgentineanArmenianAssyrian/Chaldean/SyriacAustralianAustrianBahamianBangladeshiBarbadianBasqueBelgianBelizeanBermudanBhutaneseBlackfeetBolivianBrazilianBritishBritish West IndianBulgarianBurmeseCajunCambodianCanadianCape VerdeanCarpatho RusynCelticCentral AmericanCentral American IndianCherokeeCheyenneChickasawChileanChineseChippewaChoctawColombianColvilleComancheCosta RicanCreeCreekCroatianCrowCubanCypriotCzechCzechoslovakianDanishDelawareDominicanDutchDutch West IndianEastern EuropeanEcuadorianEgyptianEnglishEstonianEthiopianEuropeanFijianFilipinoFinnishFrenchFrench American IndianFrench CanadianGermanGerman RussianGhanaianGreekGuamanian/ChamorroGuatemalanGuyaneseHaitianHmongHonduranHopiHoumaHungarianIcelanderIndian (Asian)IndonesianInupiatIranianIraqiIrishIroquoisIsraeliItalianJamaicanJapaneseJordanianKenyanKiowaKoreanLaotianLatvianLebaneseLiberianLithuanianLumbeeLuxembourgerMacedonianMalaysianMalteseMarshalleseMenomineeMexicanMexican American IndianMongolianMoroccanNative HawaiianNavajoNepaleseNew ZealanderNicaraguanNigerianNorthern EuropeanNorwegianOkinawanOsageOttawaPaiutePakistaniPalestinianPanamanianParaguayanPennsylvania GermanPeruvianPimaPolishPortuguesePotawatomiPuebloPuerto RicanPuget Sound SalishRomanianRussianSalvadoranSamoanScandinavianScotch-IrishScottishSeminoleSenegaleseSerbianShoshoneSierra LeoneanSiouxSlavicSlovakSloveneSomaliSouth AfricanSouth AmericanSouth American IndianSoviet UnionSpaniardSpanishSpanish AmericanSpanish American IndianSri LankanSubsaharan AfricanSudaneseSwedishSwissSyrianTaiwaneseThaiTlingit-HaidaTohono O'OdhamTonganTrinidadian and TobagonianTsimshianTurkishU.S. Virgin IslanderUgandanUkrainianUruguayanUteVenezuelanVietnameseWelshWest IndianYakamaYaquiYugoslavianYumanYup'ikZimbabwean
Immigration
NonimmigrantsImmigrantsAfghanistanAfricaAlbaniaArgentinaArmeniaAsiaAustraliaAustriaBahamasBangladeshBarbadosBelarusBelgiumBelizeBoliviaBosnia and HerzegovinaBrazilBulgariaBurma/MyanmarCabo VerdeCambodiaCameroonCanadaCaribbeanCentral AmericaChileChinaColombiaCongoCosta RicaCroatiaCubaCzechoslovakiaDenmarkDominicaDominican RepublicEastern AfricaEastern AsiaEastern EuropeEcuadorEgyptEl SalvadorEnglandEritreaEthiopiaEuropeFijiFranceGermanyGhanaGreeceGrenadaGuatemalaGuyanaHaitiHondurasHong KongHungaryIndiaIndonesiaIranIraqIrelandIsraelItalyJamaicaJapanJordanKazakhstanKenyaKoreaKuwaitLaosLatin AmericaLatviaLebanonLiberiaLithuaniaMalaysiaMexicoMicronesiaMiddle AfricaMoldovaMoroccoNepalNetherlandsNicaraguaNigeriaNorth AmericaNorth MacedoniaNorthern AfricaNorthern EuropeNorwayOceaniaPakistanPanamaPeruPhilippinesPolandPortugalRomaniaRussiaSaudi ArabiaScotlandSenegalSerbiaSierra LeoneSingaporeSomaliaSouth AfricaSouth AmericaSouth Central AsiaSouth Eastern AsiaSouthern EuropeSpainSri LankaSt. Vincent and the GrenadinesSudanSwedenSwitzerlandSyriaTaiwanThailandTrinidad and TobagoTurkeyUgandaUkraineUruguayUzbekistanVenezuelaVietnamWest IndiesWestern AfricaWestern AsiaWestern EuropeYemenZaireZimbabweAzores
Select to Compare
Race
Ancestry
AfghanAfricanAlaska NativeAlaskan AthabascanAlbanianAleutAlsatianAmericanApacheArabArapahoArgentineanArmenianAssyrian/Chaldean/SyriacAustralianAustrianBahamianBangladeshiBarbadianBasqueBelgianBelizeanBermudanBhutaneseBlackfeetBolivianBrazilianBritishBritish West IndianBulgarianBurmeseCajunCambodianCanadianCape VerdeanCarpatho RusynCelticCentral AmericanCentral American IndianCherokeeChickasawChileanChineseChippewaChoctawColombianColvilleComancheCosta RicanCreeCreekCroatianCrowCubanCypriotCzechCzechoslovakianDanishDelawareDominicanDutchDutch West IndianEastern EuropeanEcuadorianEgyptianEnglishEstonianEthiopianEuropeanFijianFilipinoFinnishFrenchFrench American IndianFrench CanadianGermanGerman RussianGhanaianGreekGuamanian/ChamorroGuatemalanGuyaneseHaitianHmongHonduranHopiHoumaHungarianIcelanderIndian (Asian)IndonesianInupiatIranianIraqiIrishIroquoisIsraeliItalianJamaicanJapaneseJordanianKenyanKiowaKoreanLaotianLatvianLebaneseLiberianLithuanianLumbeeLuxembourgerMacedonianMalaysianMalteseMarshalleseMenomineeMexicanMexican American IndianMongolianMoroccanNative HawaiianNavajoNepaleseNew ZealanderNicaraguanNigerianNorthern EuropeanNorwegianOkinawanOsageOttawaPaiutePakistaniPalestinianPanamanianParaguayanPennsylvania GermanPeruvianPimaPolishPortuguesePotawatomiPuebloPuerto RicanPuget Sound SalishRomanianRussianSalvadoranSamoanScandinavianScotch-IrishScottishSeminoleSenegaleseSerbianShoshoneSierra LeoneanSiouxSlavicSlovakSloveneSomaliSouth AfricanSouth AmericanSouth American IndianSoviet UnionSpaniardSpanishSpanish AmericanSpanish American IndianSri LankanSubsaharan AfricanSudaneseSwedishSwissSyrianTaiwaneseThaiTlingit-HaidaTohono O'OdhamTonganTrinidadian and TobagonianTsimshianTurkishU.S. Virgin IslanderUgandanUkrainianUruguayanUteVenezuelanVietnameseWelshWest IndianYakamaYaquiYugoslavianYumanYup'ikZimbabwean
Immigration
NonimmigrantsImmigrantsAfghanistanAfricaAlbaniaArgentinaArmeniaAsiaAustraliaAustriaBahamasBangladeshBarbadosBelarusBelgiumBelizeBoliviaBosnia and HerzegovinaBrazilBulgariaBurma/MyanmarCabo VerdeCambodiaCameroonCanadaCaribbeanCentral AmericaChileChinaColombiaCongoCosta RicaCroatiaCubaCzechoslovakiaDenmarkDominicaDominican RepublicEastern AfricaEastern AsiaEastern EuropeEcuadorEgyptEl SalvadorEnglandEritreaEthiopiaEuropeFijiFranceGermanyGhanaGreeceGrenadaGuatemalaGuyanaHaitiHondurasHong KongHungaryIndiaIndonesiaIranIraqIrelandIsraelItalyJamaicaJapanJordanKazakhstanKenyaKoreaKuwaitLaosLatin AmericaLatviaLebanonLiberiaLithuaniaMalaysiaMexicoMicronesiaMiddle AfricaMoldovaMoroccoNepalNetherlandsNicaraguaNigeriaNorth AmericaNorth MacedoniaNorthern AfricaNorthern EuropeNorwayOceaniaPakistanPanamaPeruPhilippinesPolandPortugalRomaniaRussiaSaudi ArabiaScotlandSenegalSerbiaSierra LeoneSingaporeSomaliaSouth AfricaSouth AmericaSouth Central AsiaSouth Eastern AsiaSouthern EuropeSpainSri LankaSt. Vincent and the GrenadinesSudanSwedenSwitzerlandSyriaTaiwanThailandTrinidad and TobagoTurkeyUgandaUkraineUruguayUzbekistanVenezuelaVietnamWest IndiesWestern AfricaWestern AsiaWestern EuropeYemenZaireZimbabweAzores
Wage/Income Gap
Income
Poverty
Unemployment
Labor Participation
Family Structure
Vehicle Availability
Education Level
Disability

Cheyenne Wage/Income Gap
Exceptional

23.3%
WAGE/INCOME GAP
99.7/ 100
METRIC RATING
86th/ 347
METRIC RANK

Cheyenne Wage/Income Gap Correlation Chart

The statistical analysis conducted on geographies consisting of 80,669,985 people shows a weak negative correlation between the proportion of Cheyenne and wage/income gap percentage in the United States with a correlation coefficient (R) of -0.213 and weighted average of 23.3%. On average, for every 1% (one percent) increase in Cheyenne within a typical geography, there is a decrease of 0.12% in wage/income gap percentage.
Cheyenne Wage/Income Gap
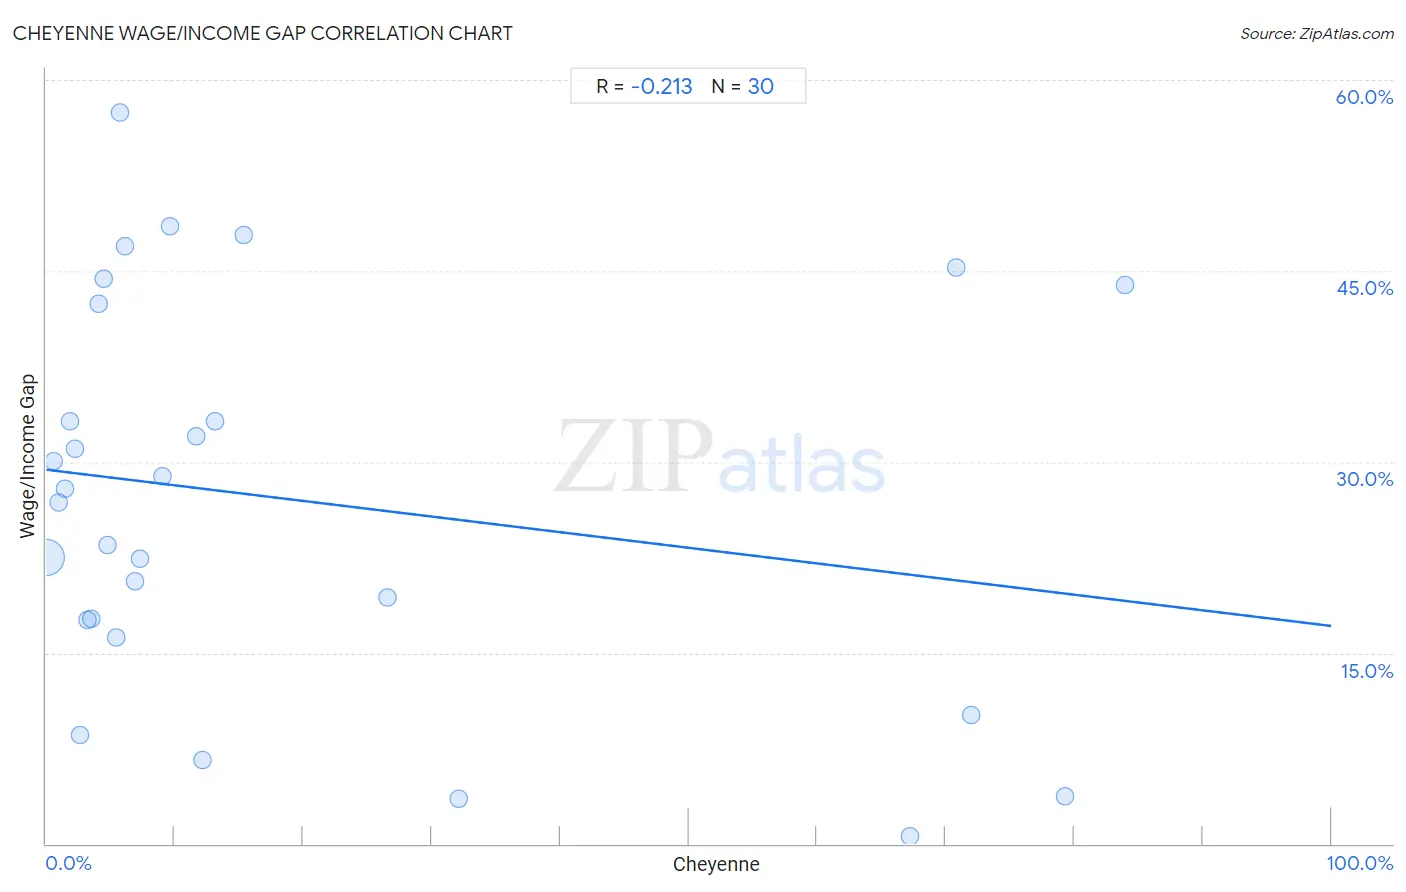
It is essential to understand that the correlation between the percentage of Cheyenne and wage/income gap percentage does not imply a direct cause-and-effect relationship. It remains uncertain whether the presence of Cheyenne influences an upward or downward trend in the level of wage/income gap percentage within an area, or if Cheyenne simply ended up residing in those areas with higher or lower levels of wage/income gap percentage due to other factors.

Demographics Similar to Cheyenne by Wage/Income Gap

In terms of wage/income gap, the demographic groups most similar to Cheyenne are Yuman (23.3%, a difference of 0.050%), Immigrants from Cambodia (23.3%, a difference of 0.20%), Cuban (23.3%, a difference of 0.26%), Immigrants from Panama (23.4%, a difference of 0.37%), and Marshallese (23.4%, a difference of 0.46%).
DemographicsRating | RankWage/Income Gap
Immigrants from Nicaragua
99.9
/100
|
#79
Exceptional
23.0%
Salvadorans
99.9
/100
|
#80
Exceptional
23.0%
Bermudans
99.8
/100
|
#81
Exceptional
23.1%
Central Americans
99.8
/100
|
#82
Exceptional
23.1%
Immigrants from Africa
99.8
/100
|
#83
Exceptional
23.2%
Cubans
99.7
/100
|
#84
Exceptional
23.3%
Immigrants from Cambodia
99.7
/100
|
#85
Exceptional
23.3%
Cheyenne
99.7
/100
|
#86
Exceptional
23.3%
Yuman
99.7
/100
|
#87
Exceptional
23.3%
Immigrants from Panama
99.6
/100
|
#88
Exceptional
23.4%
Marshallese
99.6
/100
|
#89
Exceptional
23.4%
Nicaraguans
99.6
/100
|
#90
Exceptional
23.4%
Arapaho
99.6
/100
|
#91
Exceptional
23.5%
Immigrants from Honduras
99.5
/100
|
#92
Exceptional
23.5%
Immigrants from Cabo Verde
99.5
/100
|
#93
Exceptional
23.6%

Cheyenne Wage/Income Gap Correlation Summary

MeasurementCheyenne DataWage/Income Gap Data
Minimum0.026%0.62%
Maximum84.0%57.5%
Range83.9%56.8%
Mean18.8%27.1%
Median6.5%27.3%
Interquartile 25% (IQ1)3.2%17.6%
Interquartile 75% (IQ3)15.3%42.4%
Interquartile Range (IQR)12.1%24.8%
Standard Deviation (Sample)26.5%15.3%
Standard Deviation (Population)26.0%15.0%

Correlation Details

Cheyenne PercentileSample SizeWage/Income Gap
[
0.0%
-
0.5%
]
0.026%
79,634,14122.5%
[
0.5%
-
1.0%
]
0.58%
510,17630.1%
[
1.0%
-
1.5%
]
1.00%
364,01426.8%
[
1.0%
-
1.5%
]
1.45%
47,28727.9%
[
1.5%
-
2.0%
]
1.87%
41,82633.2%
[
2.0%
-
2.5%
]
2.27%
15,13831.0%
[
2.5%
-
3.0%
]
2.63%
6,1588.6%
[
3.0%
-
3.5%
]
3.20%
9,02217.6%
[
3.5%
-
4.0%
]
3.52%
5,85917.7%
[
4.0%
-
4.5%
]
4.09%
8,70242.4%
[
4.0%
-
4.5%
]
4.47%
2,32944.4%
[
4.5%
-
5.0%
]
4.74%
2,57223.5%
[
5.0%
-
5.5%
]
5.45%
22016.2%
[
5.5%
-
6.0%
]
5.70%
2,65157.5%
[
6.0%
-
6.5%
]
6.13%
21247.0%
[
6.5%
-
7.0%
]
6.92%
1,60320.6%
[
7.0%
-
7.5%
]
7.26%
1,68022.3%
[
9.0%
-
9.5%
]
9.00%
10028.8%
[
9.5%
-
10.0%
]
9.58%
4,65448.5%
[
11.5%
-
12.0%
]
11.67%
6032.0%
[
12.0%
-
12.5%
]
12.12%
1,6926.6%
[
13.0%
-
13.5%
]
13.18%
38733.2%
[
15.0%
-
15.5%
]
15.35%
39147.9%
[
26.5%
-
27.0%
]
26.58%
1,12519.4%
[
32.0%
-
32.5%
]
32.06%
7833.5%
[
67.0%
-
67.5%
]
67.20%
2,0640.62%
[
70.5%
-
71.0%
]
70.81%
96645.3%
[
71.5%
-
72.0%
]
71.99%
3,03810.1%
[
79.0%
-
79.5%
]
79.32%
4743.7%
[
83.5%
-
84.0%
]
83.96%
66143.9%