Immigrants from Taiwan Wage/Income Gap
COMPARE
Immigrants from Taiwan
Select to Compare
Wage/Income Gap
Immigrants from Taiwan Wage/Income Gap
29.5%
WAGE/INCOME GAP
0.0/ 100
METRIC RATING
335th/ 347
METRIC RANK
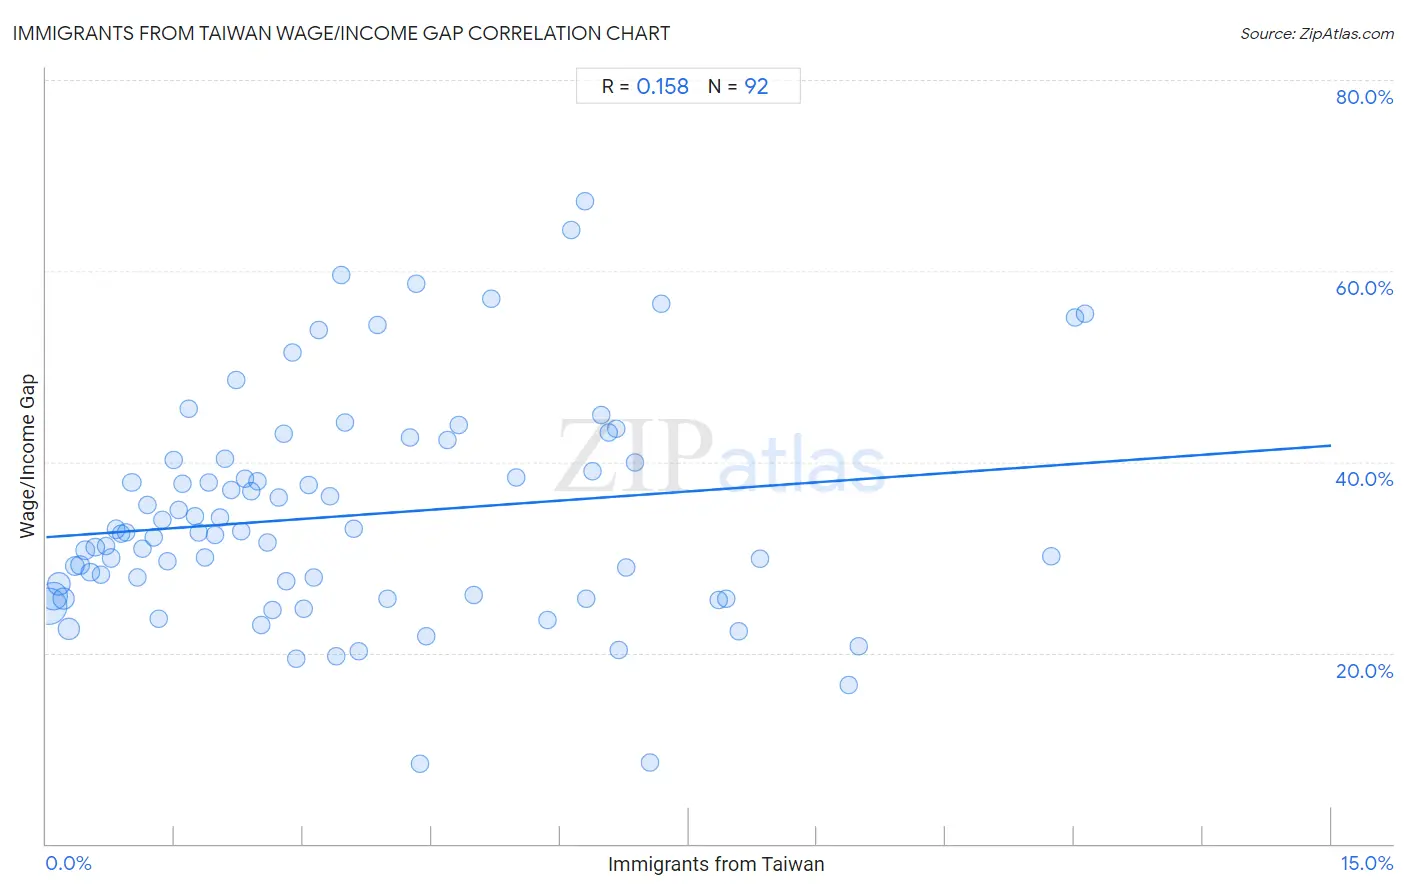
Immigrants from Taiwan Wage/Income Gap Correlation Chart
The statistical analysis conducted on geographies consisting of 298,208,657 people shows a poor positive correlation between the proportion of Immigrants from Taiwan and wage/income gap percentage in the United States with a correlation coefficient (R) of 0.158 and weighted average of 29.5%. On average, for every 1% (one percent) increase in Immigrants from Taiwan within a typical geography, there is an increase of 0.64% in wage/income gap percentage.
It is essential to understand that the correlation between the percentage of Immigrants from Taiwan and wage/income gap percentage does not imply a direct cause-and-effect relationship. It remains uncertain whether the presence of Immigrants from Taiwan influences an upward or downward trend in the level of wage/income gap percentage within an area, or if Immigrants from Taiwan simply ended up residing in those areas with higher or lower levels of wage/income gap percentage due to other factors.
Demographics Similar to Immigrants from Taiwan by Wage/Income Gap
In terms of wage/income gap, the demographic groups most similar to Immigrants from Taiwan are English (29.5%, a difference of 0.010%), Swedish (29.4%, a difference of 0.13%), European (29.4%, a difference of 0.27%), Immigrants from South Central Asia (29.3%, a difference of 0.46%), and Dutch (29.6%, a difference of 0.59%).
| Demographics | Rating | Rank | Wage/Income Gap |
| Scandinavians | 0.0 /100 | #328 | Tragic 29.1% |
| Scottish | 0.0 /100 | #329 | Tragic 29.1% |
| Germans | 0.0 /100 | #330 | Tragic 29.2% |
| Czechs | 0.0 /100 | #331 | Tragic 29.2% |
| Immigrants from South Central Asia | 0.0 /100 | #332 | Tragic 29.3% |
| Europeans | 0.0 /100 | #333 | Tragic 29.4% |
| Swedes | 0.0 /100 | #334 | Tragic 29.4% |
| Immigrants from Taiwan | 0.0 /100 | #335 | Tragic 29.5% |
| English | 0.0 /100 | #336 | Tragic 29.5% |
| Dutch | 0.0 /100 | #337 | Tragic 29.6% |
| Filipinos | 0.0 /100 | #338 | Tragic 29.7% |
| Iranians | 0.0 /100 | #339 | Tragic 29.7% |
| Swiss | 0.0 /100 | #340 | Tragic 30.0% |
| Thais | 0.0 /100 | #341 | Tragic 30.5% |
| Pennsylvania Germans | 0.0 /100 | #342 | Tragic 30.7% |
Immigrants from Taiwan Wage/Income Gap Correlation Summary
| Measurement | Immigrants from Taiwan Data | Wage/Income Gap Data |
| Minimum | 0.032% | 8.4% |
| Maximum | 12.1% | 67.2% |
| Range | 12.1% | 58.8% |
| Mean | 3.6% | 34.4% |
| Median | 2.8% | 32.5% |
| Interquartile 25% (IQ1) | 1.4% | 26.0% |
| Interquartile 75% (IQ3) | 5.3% | 40.1% |
| Interquartile Range (IQR) | 3.9% | 14.1% |
| Standard Deviation (Sample) | 2.9% | 11.6% |
| Standard Deviation (Population) | 2.8% | 11.5% |
Correlation Details
| Immigrants from Taiwan Percentile | Sample Size | Wage/Income Gap |
[ 0.0% - 0.5% ] 0.032% | 111,306,539 | 24.8% |
[ 0.0% - 0.5% ] 0.084% | 60,922,728 | 26.0% |
[ 0.0% - 0.5% ] 0.15% | 28,380,478 | 27.2% |
[ 0.0% - 0.5% ] 0.21% | 23,705,265 | 25.6% |
[ 0.0% - 0.5% ] 0.26% | 20,869,684 | 22.5% |
[ 0.0% - 0.5% ] 0.33% | 9,717,853 | 29.1% |
[ 0.0% - 0.5% ] 0.39% | 6,487,193 | 29.2% |
[ 0.0% - 0.5% ] 0.46% | 4,473,267 | 30.8% |
[ 0.5% - 1.0% ] 0.51% | 3,796,714 | 28.5% |
[ 0.5% - 1.0% ] 0.58% | 4,024,277 | 31.1% |
[ 0.5% - 1.0% ] 0.64% | 3,508,493 | 28.2% |
[ 0.5% - 1.0% ] 0.70% | 2,495,646 | 31.2% |
[ 0.5% - 1.0% ] 0.76% | 1,672,289 | 29.9% |
[ 0.5% - 1.0% ] 0.82% | 1,393,171 | 32.9% |
[ 0.5% - 1.0% ] 0.88% | 1,192,419 | 32.5% |
[ 0.5% - 1.0% ] 0.94% | 1,132,438 | 32.6% |
[ 0.5% - 1.0% ] 1.00% | 907,013 | 37.8% |
[ 1.0% - 1.5% ] 1.06% | 1,029,334 | 27.8% |
[ 1.0% - 1.5% ] 1.12% | 769,940 | 30.9% |
[ 1.0% - 1.5% ] 1.18% | 767,757 | 35.5% |
[ 1.0% - 1.5% ] 1.25% | 580,086 | 32.1% |
[ 1.0% - 1.5% ] 1.31% | 160,364 | 23.5% |
[ 1.0% - 1.5% ] 1.35% | 1,682,824 | 33.9% |
[ 1.0% - 1.5% ] 1.42% | 234,522 | 29.7% |
[ 1.0% - 1.5% ] 1.48% | 497,074 | 40.2% |
[ 1.5% - 2.0% ] 1.54% | 659,535 | 34.9% |
[ 1.5% - 2.0% ] 1.59% | 106,109 | 37.7% |
[ 1.5% - 2.0% ] 1.67% | 259,288 | 45.6% |
[ 1.5% - 2.0% ] 1.74% | 104,480 | 34.3% |
[ 1.5% - 2.0% ] 1.78% | 55,826 | 32.6% |
[ 1.5% - 2.0% ] 1.86% | 404,643 | 30.0% |
[ 1.5% - 2.0% ] 1.90% | 268,133 | 37.8% |
[ 1.5% - 2.0% ] 1.97% | 612,178 | 32.3% |
[ 2.0% - 2.5% ] 2.02% | 99,729 | 34.1% |
[ 2.0% - 2.5% ] 2.09% | 197,515 | 40.3% |
[ 2.0% - 2.5% ] 2.15% | 141,595 | 37.1% |
[ 2.0% - 2.5% ] 2.22% | 68,508 | 48.6% |
[ 2.0% - 2.5% ] 2.28% | 96,497 | 32.8% |
[ 2.0% - 2.5% ] 2.32% | 426,528 | 38.2% |
[ 2.0% - 2.5% ] 2.39% | 46,823 | 37.0% |
[ 2.0% - 2.5% ] 2.47% | 287,905 | 37.9% |
[ 2.5% - 3.0% ] 2.51% | 102,158 | 22.9% |
[ 2.5% - 3.0% ] 2.58% | 198,983 | 31.5% |
[ 2.5% - 3.0% ] 2.64% | 114,547 | 24.4% |
[ 2.5% - 3.0% ] 2.71% | 84,820 | 36.3% |
[ 2.5% - 3.0% ] 2.77% | 12,397 | 42.9% |
[ 2.5% - 3.0% ] 2.80% | 172,086 | 27.5% |
[ 2.5% - 3.0% ] 2.88% | 38,003 | 51.4% |
[ 2.5% - 3.0% ] 2.91% | 212,221 | 19.3% |
[ 3.0% - 3.5% ] 3.00% | 63,649 | 24.6% |
[ 3.0% - 3.5% ] 3.06% | 273,341 | 37.5% |
[ 3.0% - 3.5% ] 3.13% | 46,906 | 27.9% |
[ 3.0% - 3.5% ] 3.18% | 7,559 | 53.8% |
[ 3.0% - 3.5% ] 3.31% | 17,826 | 36.4% |
[ 3.0% - 3.5% ] 3.39% | 52,587 | 19.7% |
[ 3.0% - 3.5% ] 3.45% | 1,277 | 59.6% |
[ 3.0% - 3.5% ] 3.49% | 24,692 | 44.1% |
[ 3.5% - 4.0% ] 3.59% | 61,940 | 33.1% |
[ 3.5% - 4.0% ] 3.64% | 40,981 | 20.2% |
[ 3.5% - 4.0% ] 3.86% | 20,442 | 54.3% |
[ 3.5% - 4.0% ] 3.98% | 5,170 | 25.7% |
[ 4.0% - 4.5% ] 4.25% | 34,904 | 42.5% |
[ 4.0% - 4.5% ] 4.31% | 2,109 | 58.6% |
[ 4.0% - 4.5% ] 4.37% | 5,474 | 8.4% |
[ 4.0% - 4.5% ] 4.44% | 31,335 | 21.7% |
[ 4.5% - 5.0% ] 4.69% | 8,362 | 42.4% |
[ 4.5% - 5.0% ] 4.81% | 2,890 | 43.9% |
[ 4.5% - 5.0% ] 4.99% | 98,350 | 26.1% |
[ 5.0% - 5.5% ] 5.19% | 8,441 | 57.1% |
[ 5.0% - 5.5% ] 5.48% | 62,451 | 38.4% |
[ 5.5% - 6.0% ] 5.85% | 35,556 | 23.4% |
[ 6.0% - 6.5% ] 6.13% | 767 | 64.3% |
[ 6.0% - 6.5% ] 6.29% | 954 | 67.2% |
[ 6.0% - 6.5% ] 6.31% | 36,909 | 25.7% |
[ 6.0% - 6.5% ] 6.38% | 31,688 | 39.0% |
[ 6.0% - 6.5% ] 6.47% | 61,414 | 44.9% |
[ 6.5% - 7.0% ] 6.57% | 4,463 | 43.1% |
[ 6.5% - 7.0% ] 6.65% | 90,534 | 43.4% |
[ 6.5% - 7.0% ] 6.69% | 110,950 | 20.3% |
[ 6.5% - 7.0% ] 6.76% | 33,367 | 28.9% |
[ 6.5% - 7.0% ] 6.88% | 53,464 | 40.0% |
[ 7.0% - 7.5% ] 7.04% | 24,169 | 8.6% |
[ 7.0% - 7.5% ] 7.18% | 1,031 | 56.6% |
[ 7.5% - 8.0% ] 7.85% | 73,363 | 25.6% |
[ 7.5% - 8.0% ] 7.94% | 54,534 | 25.7% |
[ 8.0% - 8.5% ] 8.09% | 84,393 | 22.3% |
[ 8.0% - 8.5% ] 8.33% | 45,303 | 29.9% |
[ 9.0% - 9.5% ] 9.37% | 43,851 | 16.6% |
[ 9.0% - 9.5% ] 9.48% | 47,209 | 20.7% |
[ 11.5% - 12.0% ] 11.73% | 1,176 | 30.1% |
[ 12.0% - 12.5% ] 12.01% | 12,559 | 55.1% |
[ 12.0% - 12.5% ] 12.12% | 12,442 | 55.6% |