Immigrants from Kuwait Wage/Income Gap

COMPARE

Immigrants from Kuwait
Race
Ancestry
AfghanAfricanAlaska NativeAlaskan AthabascanAlbanianAleutAlsatianAmericanApacheArabArapahoArgentineanArmenianAssyrian/Chaldean/SyriacAustralianAustrianBahamianBangladeshiBarbadianBasqueBelgianBelizeanBermudanBhutaneseBlackfeetBolivianBrazilianBritishBritish West IndianBulgarianBurmeseCajunCambodianCanadianCape VerdeanCarpatho RusynCelticCentral AmericanCentral American IndianCherokeeCheyenneChickasawChileanChineseChippewaChoctawColombianColvilleComancheCosta RicanCreeCreekCroatianCrowCubanCypriotCzechCzechoslovakianDanishDelawareDominicanDutchDutch West IndianEastern EuropeanEcuadorianEgyptianEnglishEstonianEthiopianEuropeanFijianFilipinoFinnishFrenchFrench American IndianFrench CanadianGermanGerman RussianGhanaianGreekGuamanian/ChamorroGuatemalanGuyaneseHaitianHmongHonduranHopiHoumaHungarianIcelanderIndian (Asian)IndonesianInupiatIranianIraqiIrishIroquoisIsraeliItalianJamaicanJapaneseJordanianKenyanKiowaKoreanLaotianLatvianLebaneseLiberianLithuanianLumbeeLuxembourgerMacedonianMalaysianMalteseMarshalleseMenomineeMexicanMexican American IndianMongolianMoroccanNative HawaiianNavajoNepaleseNew ZealanderNicaraguanNigerianNorthern EuropeanNorwegianOkinawanOsageOttawaPaiutePakistaniPalestinianPanamanianParaguayanPennsylvania GermanPeruvianPimaPolishPortuguesePotawatomiPuebloPuerto RicanPuget Sound SalishRomanianRussianSalvadoranSamoanScandinavianScotch-IrishScottishSeminoleSenegaleseSerbianShoshoneSierra LeoneanSiouxSlavicSlovakSloveneSomaliSouth AfricanSouth AmericanSouth American IndianSoviet UnionSpaniardSpanishSpanish AmericanSpanish American IndianSri LankanSubsaharan AfricanSudaneseSwedishSwissSyrianTaiwaneseThaiTlingit-HaidaTohono O'OdhamTonganTrinidadian and TobagonianTsimshianTurkishU.S. Virgin IslanderUgandanUkrainianUruguayanUteVenezuelanVietnameseWelshWest IndianYakamaYaquiYugoslavianYumanYup'ikZimbabwean
Immigration
NonimmigrantsImmigrantsAfghanistanAfricaAlbaniaArgentinaArmeniaAsiaAustraliaAustriaBahamasBangladeshBarbadosBelarusBelgiumBelizeBoliviaBosnia and HerzegovinaBrazilBulgariaBurma/MyanmarCabo VerdeCambodiaCameroonCanadaCaribbeanCentral AmericaChileChinaColombiaCongoCosta RicaCroatiaCubaCzechoslovakiaDenmarkDominicaDominican RepublicEastern AfricaEastern AsiaEastern EuropeEcuadorEgyptEl SalvadorEnglandEritreaEthiopiaEuropeFijiFranceGermanyGhanaGreeceGrenadaGuatemalaGuyanaHaitiHondurasHong KongHungaryIndiaIndonesiaIranIraqIrelandIsraelItalyJamaicaJapanJordanKazakhstanKenyaKoreaKuwaitLaosLatin AmericaLatviaLebanonLiberiaLithuaniaMalaysiaMexicoMicronesiaMiddle AfricaMoldovaMoroccoNepalNetherlandsNicaraguaNigeriaNorth AmericaNorth MacedoniaNorthern AfricaNorthern EuropeNorwayOceaniaPakistanPanamaPeruPhilippinesPolandPortugalRomaniaRussiaSaudi ArabiaScotlandSenegalSerbiaSierra LeoneSingaporeSomaliaSouth AfricaSouth AmericaSouth Central AsiaSouth Eastern AsiaSouthern EuropeSpainSri LankaSt. Vincent and the GrenadinesSudanSwedenSwitzerlandSyriaTaiwanThailandTrinidad and TobagoTurkeyUgandaUkraineUruguayUzbekistanVenezuelaVietnamWest IndiesWestern AfricaWestern AsiaWestern EuropeYemenZaireZimbabweAzores
Select to Compare
Race
Ancestry
AfghanAfricanAlaska NativeAlaskan AthabascanAlbanianAleutAlsatianAmericanApacheArabArapahoArgentineanArmenianAssyrian/Chaldean/SyriacAustralianAustrianBahamianBangladeshiBarbadianBasqueBelgianBelizeanBermudanBhutaneseBlackfeetBolivianBrazilianBritishBritish West IndianBulgarianBurmeseCajunCambodianCanadianCape VerdeanCarpatho RusynCelticCentral AmericanCentral American IndianCherokeeCheyenneChickasawChileanChineseChippewaChoctawColombianColvilleComancheCosta RicanCreeCreekCroatianCrowCubanCypriotCzechCzechoslovakianDanishDelawareDominicanDutchDutch West IndianEastern EuropeanEcuadorianEgyptianEnglishEstonianEthiopianEuropeanFijianFilipinoFinnishFrenchFrench American IndianFrench CanadianGermanGerman RussianGhanaianGreekGuamanian/ChamorroGuatemalanGuyaneseHaitianHmongHonduranHopiHoumaHungarianIcelanderIndian (Asian)IndonesianInupiatIranianIraqiIrishIroquoisIsraeliItalianJamaicanJapaneseJordanianKenyanKiowaKoreanLaotianLatvianLebaneseLiberianLithuanianLumbeeLuxembourgerMacedonianMalaysianMalteseMarshalleseMenomineeMexicanMexican American IndianMongolianMoroccanNative HawaiianNavajoNepaleseNew ZealanderNicaraguanNigerianNorthern EuropeanNorwegianOkinawanOsageOttawaPaiutePakistaniPalestinianPanamanianParaguayanPennsylvania GermanPeruvianPimaPolishPortuguesePotawatomiPuebloPuerto RicanPuget Sound SalishRomanianRussianSalvadoranSamoanScandinavianScotch-IrishScottishSeminoleSenegaleseSerbianShoshoneSierra LeoneanSiouxSlavicSlovakSloveneSomaliSouth AfricanSouth AmericanSouth American IndianSoviet UnionSpaniardSpanishSpanish AmericanSpanish American IndianSri LankanSubsaharan AfricanSudaneseSwedishSwissSyrianTaiwaneseThaiTlingit-HaidaTohono O'OdhamTonganTrinidadian and TobagonianTsimshianTurkishU.S. Virgin IslanderUgandanUkrainianUruguayanUteVenezuelanVietnameseWelshWest IndianYakamaYaquiYugoslavianYumanYup'ikZimbabwean
Immigration
NonimmigrantsImmigrantsAfghanistanAfricaAlbaniaArgentinaArmeniaAsiaAustraliaAustriaBahamasBangladeshBarbadosBelarusBelgiumBelizeBoliviaBosnia and HerzegovinaBrazilBulgariaBurma/MyanmarCabo VerdeCambodiaCameroonCanadaCaribbeanCentral AmericaChileChinaColombiaCongoCosta RicaCroatiaCubaCzechoslovakiaDenmarkDominicaDominican RepublicEastern AfricaEastern AsiaEastern EuropeEcuadorEgyptEl SalvadorEnglandEritreaEthiopiaEuropeFijiFranceGermanyGhanaGreeceGrenadaGuatemalaGuyanaHaitiHondurasHong KongHungaryIndiaIndonesiaIranIraqIrelandIsraelItalyJamaicaJapanJordanKazakhstanKenyaKoreaLaosLatin AmericaLatviaLebanonLiberiaLithuaniaMalaysiaMexicoMicronesiaMiddle AfricaMoldovaMoroccoNepalNetherlandsNicaraguaNigeriaNorth AmericaNorth MacedoniaNorthern AfricaNorthern EuropeNorwayOceaniaPakistanPanamaPeruPhilippinesPolandPortugalRomaniaRussiaSaudi ArabiaScotlandSenegalSerbiaSierra LeoneSingaporeSomaliaSouth AfricaSouth AmericaSouth Central AsiaSouth Eastern AsiaSouthern EuropeSpainSri LankaSt. Vincent and the GrenadinesSudanSwedenSwitzerlandSyriaTaiwanThailandTrinidad and TobagoTurkeyUgandaUkraineUruguayUzbekistanVenezuelaVietnamWest IndiesWestern AfricaWestern AsiaWestern EuropeYemenZaireZimbabweAzores
Wage/Income Gap
Income
Poverty
Unemployment
Labor Participation
Family Structure
Vehicle Availability
Education Level
Disability

Immigrants from Kuwait Wage/Income Gap
Poor

26.6%
WAGE/INCOME GAP
12.6/ 100
METRIC RATING
209th/ 347
METRIC RANK

Immigrants from Kuwait Wage/Income Gap Correlation Chart

The statistical analysis conducted on geographies consisting of 136,915,503 people shows a slight positive correlation between the proportion of Immigrants from Kuwait and wage/income gap percentage in the United States with a correlation coefficient (R) of 0.058 and weighted average of 26.6%. On average, for every 1% (one percent) increase in Immigrants from Kuwait within a typical geography, there is an increase of 0.92% in wage/income gap percentage.
Immigrants from Kuwait Wage/Income Gap
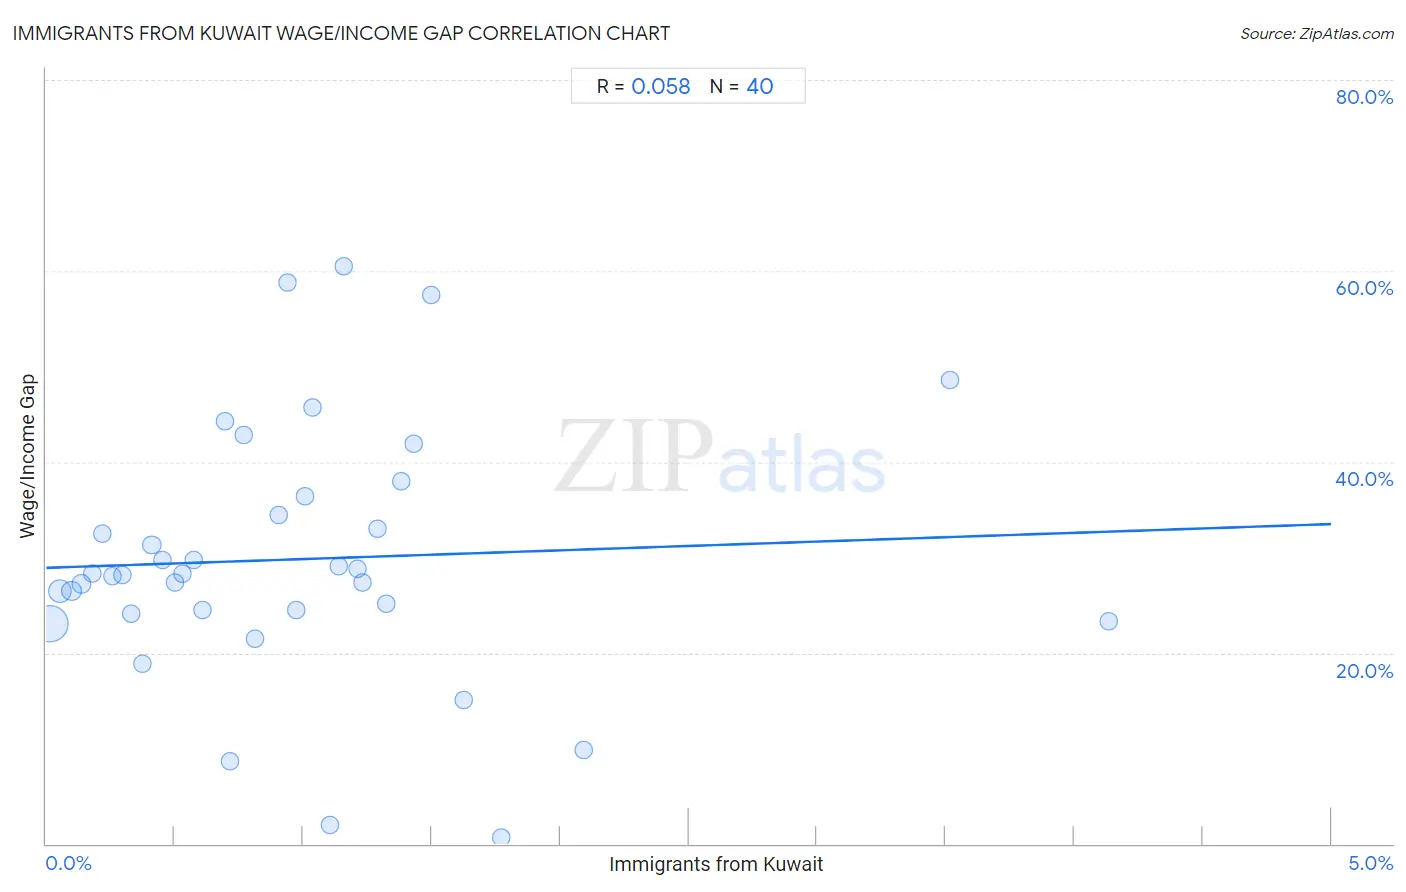
It is essential to understand that the correlation between the percentage of Immigrants from Kuwait and wage/income gap percentage does not imply a direct cause-and-effect relationship. It remains uncertain whether the presence of Immigrants from Kuwait influences an upward or downward trend in the level of wage/income gap percentage within an area, or if Immigrants from Kuwait simply ended up residing in those areas with higher or lower levels of wage/income gap percentage due to other factors.

Demographics Similar to Immigrants from Kuwait by Wage/Income Gap

In terms of wage/income gap, the demographic groups most similar to Immigrants from Kuwait are Egyptian (26.6%, a difference of 0.020%), Arab (26.6%, a difference of 0.040%), Mongolian (26.6%, a difference of 0.17%), Iraqi (26.6%, a difference of 0.20%), and Immigrants from Iraq (26.7%, a difference of 0.35%).
DemographicsRating | RankWage/Income Gap
Laotians
19.2
/100
|
#202
Poor
26.4%
Immigrants from Eastern Europe
19.2
/100
|
#203
Poor
26.4%
Immigrants from Russia
19.0
/100
|
#204
Poor
26.4%
Immigrants from Southern Europe
17.3
/100
|
#205
Poor
26.4%
Indians (Asian)
16.5
/100
|
#206
Poor
26.4%
Immigrants from Italy
15.8
/100
|
#207
Poor
26.5%
Egyptians
12.7
/100
|
#208
Poor
26.6%
Immigrants from Kuwait
12.6
/100
|
#209
Poor
26.6%
Arabs
12.3
/100
|
#210
Poor
26.6%
Mongolians
11.4
/100
|
#211
Poor
26.6%
Iraqis
11.2
/100
|
#212
Poor
26.6%
Immigrants from Iraq
10.3
/100
|
#213
Poor
26.7%
Immigrants from China
10.3
/100
|
#214
Poor
26.7%
Yugoslavians
9.7
/100
|
#215
Tragic
26.7%
Immigrants from Portugal
9.5
/100
|
#216
Tragic
26.7%

Immigrants from Kuwait Wage/Income Gap Correlation Summary

MeasurementImmigrants from Kuwait DataWage/Income Gap Data
Minimum0.016%0.69%
Maximum4.1%60.5%
Range4.1%59.8%
Mean0.97%29.8%
Median0.86%28.2%
Interquartile 25% (IQ1)0.39%24.3%
Interquartile 75% (IQ3)1.3%35.4%
Interquartile Range (IQR)0.87%11.1%
Standard Deviation (Sample)0.84%13.4%
Standard Deviation (Population)0.83%13.2%

Correlation Details

Immigrants from Kuwait PercentileSample SizeWage/Income Gap
[
0.0%
-
0.5%
]
0.016%
90,423,17123.0%
[
0.0%
-
0.5%
]
0.055%
25,048,98326.4%
[
0.0%
-
0.5%
]
0.098%
9,270,68026.5%
[
0.0%
-
0.5%
]
0.14%
4,653,47327.2%
[
0.0%
-
0.5%
]
0.18%
2,151,83028.3%
[
0.0%
-
0.5%
]
0.22%
1,590,43432.5%
[
0.0%
-
0.5%
]
0.26%
961,59728.1%
[
0.0%
-
0.5%
]
0.30%
634,98428.2%
[
0.0%
-
0.5%
]
0.33%
395,77024.1%
[
0.0%
-
0.5%
]
0.37%
344,86618.9%
[
0.0%
-
0.5%
]
0.41%
450,59131.3%
[
0.0%
-
0.5%
]
0.45%
176,78229.8%
[
0.5%
-
1.0%
]
0.50%
132,57127.4%
[
0.5%
-
1.0%
]
0.53%
141,22228.2%
[
0.5%
-
1.0%
]
0.57%
65,63229.7%
[
0.5%
-
1.0%
]
0.61%
42,36424.4%
[
0.5%
-
1.0%
]
0.70%
48,27344.3%
[
0.5%
-
1.0%
]
0.72%
36,2438.6%
[
0.5%
-
1.0%
]
0.77%
21,79842.9%
[
0.5%
-
1.0%
]
0.81%
37,58321.4%
[
0.5%
-
1.0%
]
0.90%
25,13034.4%
[
0.5%
-
1.0%
]
0.94%
11,26558.7%
[
0.5%
-
1.0%
]
0.97%
42,86224.5%
[
1.0%
-
1.5%
]
1.01%
13,31536.4%
[
1.0%
-
1.5%
]
1.04%
8,40345.8%
[
1.0%
-
1.5%
]
1.11%
1,3571.9%
[
1.0%
-
1.5%
]
1.14%
30,22029.1%
[
1.0%
-
1.5%
]
1.16%
3,20060.5%
[
1.0%
-
1.5%
]
1.21%
21,34228.8%
[
1.0%
-
1.5%
]
1.23%
4,47827.3%
[
1.0%
-
1.5%
]
1.29%
3,41933.0%
[
1.0%
-
1.5%
]
1.32%
46,47325.1%
[
1.0%
-
1.5%
]
1.38%
5,20538.0%
[
1.0%
-
1.5%
]
1.43%
34,14841.9%
[
1.0%
-
1.5%
]
1.50%
1,66957.5%
[
1.5%
-
2.0%
]
1.62%
26,70815.1%
[
1.5%
-
2.0%
]
1.77%
1,4670.69%
[
2.0%
-
2.5%
]
2.09%
1,2449.9%
[
3.5%
-
4.0%
]
3.52%
2,33248.6%
[
4.0%
-
4.5%
]
4.13%
2,41923.3%