Immigrants from Moldova Wage/Income Gap

COMPARE

Immigrants from Moldova
Race
Ancestry
AfghanAfricanAlaska NativeAlaskan AthabascanAlbanianAleutAlsatianAmericanApacheArabArapahoArgentineanArmenianAssyrian/Chaldean/SyriacAustralianAustrianBahamianBangladeshiBarbadianBasqueBelgianBelizeanBermudanBhutaneseBlackfeetBolivianBrazilianBritishBritish West IndianBulgarianBurmeseCajunCambodianCanadianCape VerdeanCarpatho RusynCelticCentral AmericanCentral American IndianCherokeeCheyenneChickasawChileanChineseChippewaChoctawColombianColvilleComancheCosta RicanCreeCreekCroatianCrowCubanCypriotCzechCzechoslovakianDanishDelawareDominicanDutchDutch West IndianEastern EuropeanEcuadorianEgyptianEnglishEstonianEthiopianEuropeanFijianFilipinoFinnishFrenchFrench American IndianFrench CanadianGermanGerman RussianGhanaianGreekGuamanian/ChamorroGuatemalanGuyaneseHaitianHmongHonduranHopiHoumaHungarianIcelanderIndian (Asian)IndonesianInupiatIranianIraqiIrishIroquoisIsraeliItalianJamaicanJapaneseJordanianKenyanKiowaKoreanLaotianLatvianLebaneseLiberianLithuanianLumbeeLuxembourgerMacedonianMalaysianMalteseMarshalleseMenomineeMexicanMexican American IndianMongolianMoroccanNative HawaiianNavajoNepaleseNew ZealanderNicaraguanNigerianNorthern EuropeanNorwegianOkinawanOsageOttawaPaiutePakistaniPalestinianPanamanianParaguayanPennsylvania GermanPeruvianPimaPolishPortuguesePotawatomiPuebloPuerto RicanPuget Sound SalishRomanianRussianSalvadoranSamoanScandinavianScotch-IrishScottishSeminoleSenegaleseSerbianShoshoneSierra LeoneanSiouxSlavicSlovakSloveneSomaliSouth AfricanSouth AmericanSouth American IndianSoviet UnionSpaniardSpanishSpanish AmericanSpanish American IndianSri LankanSubsaharan AfricanSudaneseSwedishSwissSyrianTaiwaneseThaiTlingit-HaidaTohono O'OdhamTonganTrinidadian and TobagonianTsimshianTurkishU.S. Virgin IslanderUgandanUkrainianUruguayanUteVenezuelanVietnameseWelshWest IndianYakamaYaquiYugoslavianYumanYup'ikZimbabwean
Immigration
NonimmigrantsImmigrantsAfghanistanAfricaAlbaniaArgentinaArmeniaAsiaAustraliaAustriaBahamasBangladeshBarbadosBelarusBelgiumBelizeBoliviaBosnia and HerzegovinaBrazilBulgariaBurma/MyanmarCabo VerdeCambodiaCameroonCanadaCaribbeanCentral AmericaChileChinaColombiaCongoCosta RicaCroatiaCubaCzechoslovakiaDenmarkDominicaDominican RepublicEastern AfricaEastern AsiaEastern EuropeEcuadorEgyptEl SalvadorEnglandEritreaEthiopiaEuropeFijiFranceGermanyGhanaGreeceGrenadaGuatemalaGuyanaHaitiHondurasHong KongHungaryIndiaIndonesiaIranIraqIrelandIsraelItalyJamaicaJapanJordanKazakhstanKenyaKoreaKuwaitLaosLatin AmericaLatviaLebanonLiberiaLithuaniaMalaysiaMexicoMicronesiaMiddle AfricaMoldovaMoroccoNepalNetherlandsNicaraguaNigeriaNorth AmericaNorth MacedoniaNorthern AfricaNorthern EuropeNorwayOceaniaPakistanPanamaPeruPhilippinesPolandPortugalRomaniaRussiaSaudi ArabiaScotlandSenegalSerbiaSierra LeoneSingaporeSomaliaSouth AfricaSouth AmericaSouth Central AsiaSouth Eastern AsiaSouthern EuropeSpainSri LankaSt. Vincent and the GrenadinesSudanSwedenSwitzerlandSyriaTaiwanThailandTrinidad and TobagoTurkeyUgandaUkraineUruguayUzbekistanVenezuelaVietnamWest IndiesWestern AfricaWestern AsiaWestern EuropeYemenZaireZimbabweAzores
Select to Compare
Race
Ancestry
AfghanAfricanAlaska NativeAlaskan AthabascanAlbanianAleutAlsatianAmericanApacheArabArapahoArgentineanArmenianAssyrian/Chaldean/SyriacAustralianAustrianBahamianBangladeshiBarbadianBasqueBelgianBelizeanBermudanBhutaneseBlackfeetBolivianBrazilianBritishBritish West IndianBulgarianBurmeseCajunCambodianCanadianCape VerdeanCarpatho RusynCelticCentral AmericanCentral American IndianCherokeeCheyenneChickasawChileanChineseChippewaChoctawColombianColvilleComancheCosta RicanCreeCreekCroatianCrowCubanCypriotCzechCzechoslovakianDanishDelawareDominicanDutchDutch West IndianEastern EuropeanEcuadorianEgyptianEnglishEstonianEthiopianEuropeanFijianFilipinoFinnishFrenchFrench American IndianFrench CanadianGermanGerman RussianGhanaianGreekGuamanian/ChamorroGuatemalanGuyaneseHaitianHmongHonduranHopiHoumaHungarianIcelanderIndian (Asian)IndonesianInupiatIranianIraqiIrishIroquoisIsraeliItalianJamaicanJapaneseJordanianKenyanKiowaKoreanLaotianLatvianLebaneseLiberianLithuanianLumbeeLuxembourgerMacedonianMalaysianMalteseMarshalleseMenomineeMexicanMexican American IndianMongolianMoroccanNative HawaiianNavajoNepaleseNew ZealanderNicaraguanNigerianNorthern EuropeanNorwegianOkinawanOsageOttawaPaiutePakistaniPalestinianPanamanianParaguayanPennsylvania GermanPeruvianPimaPolishPortuguesePotawatomiPuebloPuerto RicanPuget Sound SalishRomanianRussianSalvadoranSamoanScandinavianScotch-IrishScottishSeminoleSenegaleseSerbianShoshoneSierra LeoneanSiouxSlavicSlovakSloveneSomaliSouth AfricanSouth AmericanSouth American IndianSoviet UnionSpaniardSpanishSpanish AmericanSpanish American IndianSri LankanSubsaharan AfricanSudaneseSwedishSwissSyrianTaiwaneseThaiTlingit-HaidaTohono O'OdhamTonganTrinidadian and TobagonianTsimshianTurkishU.S. Virgin IslanderUgandanUkrainianUruguayanUteVenezuelanVietnameseWelshWest IndianYakamaYaquiYugoslavianYumanYup'ikZimbabwean
Immigration
NonimmigrantsImmigrantsAfghanistanAfricaAlbaniaArgentinaArmeniaAsiaAustraliaAustriaBahamasBangladeshBarbadosBelarusBelgiumBelizeBoliviaBosnia and HerzegovinaBrazilBulgariaBurma/MyanmarCabo VerdeCambodiaCameroonCanadaCaribbeanCentral AmericaChileChinaColombiaCongoCosta RicaCroatiaCubaCzechoslovakiaDenmarkDominicaDominican RepublicEastern AfricaEastern AsiaEastern EuropeEcuadorEgyptEl SalvadorEnglandEritreaEthiopiaEuropeFijiFranceGermanyGhanaGreeceGrenadaGuatemalaGuyanaHaitiHondurasHong KongHungaryIndiaIndonesiaIranIraqIrelandIsraelItalyJamaicaJapanJordanKazakhstanKenyaKoreaKuwaitLaosLatin AmericaLatviaLebanonLiberiaLithuaniaMalaysiaMexicoMicronesiaMiddle AfricaMoroccoNepalNetherlandsNicaraguaNigeriaNorth AmericaNorth MacedoniaNorthern AfricaNorthern EuropeNorwayOceaniaPakistanPanamaPeruPhilippinesPolandPortugalRomaniaRussiaSaudi ArabiaScotlandSenegalSerbiaSierra LeoneSingaporeSomaliaSouth AfricaSouth AmericaSouth Central AsiaSouth Eastern AsiaSouthern EuropeSpainSri LankaSt. Vincent and the GrenadinesSudanSwedenSwitzerlandSyriaTaiwanThailandTrinidad and TobagoTurkeyUgandaUkraineUruguayUzbekistanVenezuelaVietnamWest IndiesWestern AfricaWestern AsiaWestern EuropeYemenZaireZimbabweAzores
Wage/Income Gap
Income
Poverty
Unemployment
Labor Participation
Family Structure
Vehicle Availability
Education Level
Disability

Immigrants from Moldova Wage/Income Gap
Fair

26.2%
WAGE/INCOME GAP
26.6/ 100
METRIC RATING
189th/ 347
METRIC RANK

Immigrants from Moldova Wage/Income Gap Correlation Chart

The statistical analysis conducted on geographies consisting of 124,386,174 people shows a weak positive correlation between the proportion of Immigrants from Moldova and wage/income gap percentage in the United States with a correlation coefficient (R) of 0.275 and weighted average of 26.2%. On average, for every 1% (one percent) increase in Immigrants from Moldova within a typical geography, there is an increase of 2.0% in wage/income gap percentage.
Immigrants from Moldova Wage/Income Gap
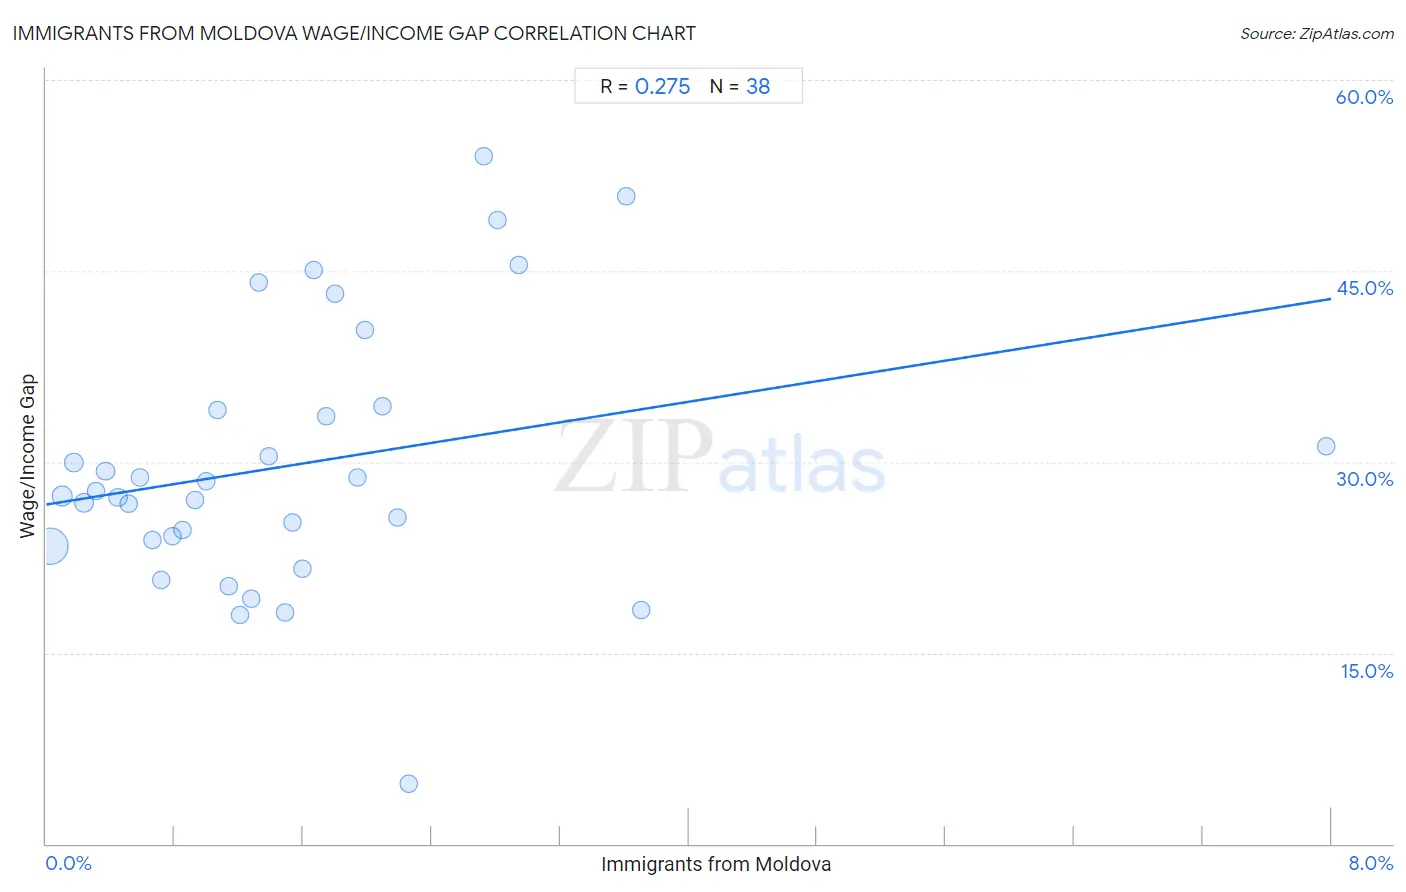
It is essential to understand that the correlation between the percentage of Immigrants from Moldova and wage/income gap percentage does not imply a direct cause-and-effect relationship. It remains uncertain whether the presence of Immigrants from Moldova influences an upward or downward trend in the level of wage/income gap percentage within an area, or if Immigrants from Moldova simply ended up residing in those areas with higher or lower levels of wage/income gap percentage due to other factors.

Demographics Similar to Immigrants from Moldova by Wage/Income Gap

In terms of wage/income gap, the demographic groups most similar to Immigrants from Moldova are Immigrants from Croatia (26.2%, a difference of 0.15%), Immigrants from Venezuela (26.2%, a difference of 0.17%), Palestinian (26.1%, a difference of 0.26%), Immigrants from Egypt (26.1%, a difference of 0.26%), and Immigrants from Bulgaria (26.3%, a difference of 0.35%).
DemographicsRating | RankWage/Income Gap
Immigrants from Serbia
35.4
/100
|
#182
Fair
26.0%
Immigrants from Kazakhstan
35.2
/100
|
#183
Fair
26.0%
Mexicans
34.4
/100
|
#184
Fair
26.0%
Pakistanis
33.7
/100
|
#185
Fair
26.1%
Immigrants from Indonesia
32.5
/100
|
#186
Fair
26.1%
Palestinians
29.9
/100
|
#187
Fair
26.1%
Immigrants from Egypt
29.9
/100
|
#188
Fair
26.1%
Immigrants from Moldova
26.6
/100
|
#189
Fair
26.2%
Immigrants from Croatia
24.8
/100
|
#190
Fair
26.2%
Immigrants from Venezuela
24.7
/100
|
#191
Fair
26.2%
Immigrants from Bulgaria
22.5
/100
|
#192
Fair
26.3%
Immigrants from Jordan
22.4
/100
|
#193
Fair
26.3%
Chileans
22.3
/100
|
#194
Fair
26.3%
Immigrants from Malaysia
22.2
/100
|
#195
Fair
26.3%
Immigrants from Western Asia
21.7
/100
|
#196
Fair
26.3%

Immigrants from Moldova Wage/Income Gap Correlation Summary

MeasurementImmigrants from Moldova DataWage/Income Gap Data
Minimum0.026%4.7%
Maximum8.0%54.0%
Range7.9%49.3%
Mean1.6%29.8%
Median1.3%27.5%
Interquartile 25% (IQ1)0.66%23.8%
Interquartile 75% (IQ3)2.0%34.0%
Interquartile Range (IQR)1.3%10.2%
Standard Deviation (Sample)1.4%10.4%
Standard Deviation (Population)1.4%10.3%

Correlation Details

Immigrants from Moldova PercentileSample SizeWage/Income Gap
[
0.0%
-
0.5%
]
0.026%
92,797,93123.4%
[
0.0%
-
0.5%
]
0.098%
15,298,69927.3%
[
0.0%
-
0.5%
]
0.17%
5,603,66429.9%
[
0.0%
-
0.5%
]
0.24%
3,433,08326.8%
[
0.0%
-
0.5%
]
0.31%
2,216,37527.7%
[
0.0%
-
0.5%
]
0.37%
862,75529.3%
[
0.0%
-
0.5%
]
0.45%
1,062,48727.2%
[
0.5%
-
1.0%
]
0.52%
444,02626.7%
[
0.5%
-
1.0%
]
0.59%
471,46328.7%
[
0.5%
-
1.0%
]
0.66%
297,25923.8%
[
0.5%
-
1.0%
]
0.71%
298,65120.7%
[
0.5%
-
1.0%
]
0.79%
268,97124.1%
[
0.5%
-
1.0%
]
0.85%
132,70724.7%
[
0.5%
-
1.0%
]
0.93%
173,01927.1%
[
0.5%
-
1.0%
]
1.00%
223,20128.5%
[
1.0%
-
1.5%
]
1.07%
45,05434.0%
[
1.0%
-
1.5%
]
1.14%
87,69920.2%
[
1.0%
-
1.5%
]
1.20%
47,93418.0%
[
1.0%
-
1.5%
]
1.28%
132,62419.2%
[
1.0%
-
1.5%
]
1.33%
25,77944.0%
[
1.0%
-
1.5%
]
1.39%
72,60130.5%
[
1.0%
-
1.5%
]
1.49%
47018.1%
[
1.5%
-
2.0%
]
1.54%
184,78225.3%
[
1.5%
-
2.0%
]
1.59%
129,85021.6%
[
1.5%
-
2.0%
]
1.67%
6,00445.1%
[
1.5%
-
2.0%
]
1.74%
17,52633.5%
[
1.5%
-
2.0%
]
1.80%
3,62043.2%
[
1.5%
-
2.0%
]
1.94%
21,08428.8%
[
1.5%
-
2.0%
]
1.98%
1,00940.3%
[
2.0%
-
2.5%
]
2.09%
2,58334.4%
[
2.0%
-
2.5%
]
2.19%
7,21825.6%
[
2.0%
-
2.5%
]
2.26%
2,5684.7%
[
2.5%
-
3.0%
]
2.72%
4,92654.0%
[
2.5%
-
3.0%
]
2.81%
2,28049.0%
[
2.5%
-
3.0%
]
2.94%
68045.5%
[
3.5%
-
4.0%
]
3.61%
38850.8%
[
3.5%
-
4.0%
]
3.71%
2,64418.4%
[
7.5%
-
8.0%
]
7.97%
2,56031.3%