Laotian Wage/Income Gap

COMPARE

Laotian
Race
Ancestry
AfghanAfricanAlaska NativeAlaskan AthabascanAlbanianAleutAlsatianAmericanApacheArabArapahoArgentineanArmenianAssyrian/Chaldean/SyriacAustralianAustrianBahamianBangladeshiBarbadianBasqueBelgianBelizeanBermudanBhutaneseBlackfeetBolivianBrazilianBritishBritish West IndianBulgarianBurmeseCajunCambodianCanadianCape VerdeanCarpatho RusynCelticCentral AmericanCentral American IndianCherokeeCheyenneChickasawChileanChineseChippewaChoctawColombianColvilleComancheCosta RicanCreeCreekCroatianCrowCubanCypriotCzechCzechoslovakianDanishDelawareDominicanDutchDutch West IndianEastern EuropeanEcuadorianEgyptianEnglishEstonianEthiopianEuropeanFijianFilipinoFinnishFrenchFrench American IndianFrench CanadianGermanGerman RussianGhanaianGreekGuamanian/ChamorroGuatemalanGuyaneseHaitianHmongHonduranHopiHoumaHungarianIcelanderIndian (Asian)IndonesianInupiatIranianIraqiIrishIroquoisIsraeliItalianJamaicanJapaneseJordanianKenyanKiowaKoreanLaotianLatvianLebaneseLiberianLithuanianLumbeeLuxembourgerMacedonianMalaysianMalteseMarshalleseMenomineeMexicanMexican American IndianMongolianMoroccanNative HawaiianNavajoNepaleseNew ZealanderNicaraguanNigerianNorthern EuropeanNorwegianOkinawanOsageOttawaPaiutePakistaniPalestinianPanamanianParaguayanPennsylvania GermanPeruvianPimaPolishPortuguesePotawatomiPuebloPuerto RicanPuget Sound SalishRomanianRussianSalvadoranSamoanScandinavianScotch-IrishScottishSeminoleSenegaleseSerbianShoshoneSierra LeoneanSiouxSlavicSlovakSloveneSomaliSouth AfricanSouth AmericanSouth American IndianSoviet UnionSpaniardSpanishSpanish AmericanSpanish American IndianSri LankanSubsaharan AfricanSudaneseSwedishSwissSyrianTaiwaneseThaiTlingit-HaidaTohono O'OdhamTonganTrinidadian and TobagonianTsimshianTurkishU.S. Virgin IslanderUgandanUkrainianUruguayanUteVenezuelanVietnameseWelshWest IndianYakamaYaquiYugoslavianYumanYup'ikZimbabwean
Immigration
NonimmigrantsImmigrantsAfghanistanAfricaAlbaniaArgentinaArmeniaAsiaAustraliaAustriaBahamasBangladeshBarbadosBelarusBelgiumBelizeBoliviaBosnia and HerzegovinaBrazilBulgariaBurma/MyanmarCabo VerdeCambodiaCameroonCanadaCaribbeanCentral AmericaChileChinaColombiaCongoCosta RicaCroatiaCubaCzechoslovakiaDenmarkDominicaDominican RepublicEastern AfricaEastern AsiaEastern EuropeEcuadorEgyptEl SalvadorEnglandEritreaEthiopiaEuropeFijiFranceGermanyGhanaGreeceGrenadaGuatemalaGuyanaHaitiHondurasHong KongHungaryIndiaIndonesiaIranIraqIrelandIsraelItalyJamaicaJapanJordanKazakhstanKenyaKoreaKuwaitLaosLatin AmericaLatviaLebanonLiberiaLithuaniaMalaysiaMexicoMicronesiaMiddle AfricaMoldovaMoroccoNepalNetherlandsNicaraguaNigeriaNorth AmericaNorth MacedoniaNorthern AfricaNorthern EuropeNorwayOceaniaPakistanPanamaPeruPhilippinesPolandPortugalRomaniaRussiaSaudi ArabiaScotlandSenegalSerbiaSierra LeoneSingaporeSomaliaSouth AfricaSouth AmericaSouth Central AsiaSouth Eastern AsiaSouthern EuropeSpainSri LankaSt. Vincent and the GrenadinesSudanSwedenSwitzerlandSyriaTaiwanThailandTrinidad and TobagoTurkeyUgandaUkraineUruguayUzbekistanVenezuelaVietnamWest IndiesWestern AfricaWestern AsiaWestern EuropeYemenZaireZimbabweAzores
Select to Compare
Race
Ancestry
AfghanAfricanAlaska NativeAlaskan AthabascanAlbanianAleutAlsatianAmericanApacheArabArapahoArgentineanArmenianAssyrian/Chaldean/SyriacAustralianAustrianBahamianBangladeshiBarbadianBasqueBelgianBelizeanBermudanBhutaneseBlackfeetBolivianBrazilianBritishBritish West IndianBulgarianBurmeseCajunCambodianCanadianCape VerdeanCarpatho RusynCelticCentral AmericanCentral American IndianCherokeeCheyenneChickasawChileanChineseChippewaChoctawColombianColvilleComancheCosta RicanCreeCreekCroatianCrowCubanCypriotCzechCzechoslovakianDanishDelawareDominicanDutchDutch West IndianEastern EuropeanEcuadorianEgyptianEnglishEstonianEthiopianEuropeanFijianFilipinoFinnishFrenchFrench American IndianFrench CanadianGermanGerman RussianGhanaianGreekGuamanian/ChamorroGuatemalanGuyaneseHaitianHmongHonduranHopiHoumaHungarianIcelanderIndian (Asian)IndonesianInupiatIranianIraqiIrishIroquoisIsraeliItalianJamaicanJapaneseJordanianKenyanKiowaKoreanLatvianLebaneseLiberianLithuanianLumbeeLuxembourgerMacedonianMalaysianMalteseMarshalleseMenomineeMexicanMexican American IndianMongolianMoroccanNative HawaiianNavajoNepaleseNew ZealanderNicaraguanNigerianNorthern EuropeanNorwegianOkinawanOsageOttawaPaiutePakistaniPalestinianPanamanianParaguayanPennsylvania GermanPeruvianPimaPolishPortuguesePotawatomiPuebloPuerto RicanPuget Sound SalishRomanianRussianSalvadoranSamoanScandinavianScotch-IrishScottishSeminoleSenegaleseSerbianShoshoneSierra LeoneanSiouxSlavicSlovakSloveneSomaliSouth AfricanSouth AmericanSouth American IndianSoviet UnionSpaniardSpanishSpanish AmericanSpanish American IndianSri LankanSubsaharan AfricanSudaneseSwedishSwissSyrianTaiwaneseThaiTlingit-HaidaTohono O'OdhamTonganTrinidadian and TobagonianTsimshianTurkishU.S. Virgin IslanderUgandanUkrainianUruguayanUteVenezuelanVietnameseWelshWest IndianYakamaYaquiYugoslavianYumanYup'ikZimbabwean
Immigration
NonimmigrantsImmigrantsAfghanistanAfricaAlbaniaArgentinaArmeniaAsiaAustraliaAustriaBahamasBangladeshBarbadosBelarusBelgiumBelizeBoliviaBosnia and HerzegovinaBrazilBulgariaBurma/MyanmarCabo VerdeCambodiaCameroonCanadaCaribbeanCentral AmericaChileChinaColombiaCongoCosta RicaCroatiaCubaCzechoslovakiaDenmarkDominicaDominican RepublicEastern AfricaEastern AsiaEastern EuropeEcuadorEgyptEl SalvadorEnglandEritreaEthiopiaEuropeFijiFranceGermanyGhanaGreeceGrenadaGuatemalaGuyanaHaitiHondurasHong KongHungaryIndiaIndonesiaIranIraqIrelandIsraelItalyJamaicaJapanJordanKazakhstanKenyaKoreaKuwaitLaosLatin AmericaLatviaLebanonLiberiaLithuaniaMalaysiaMexicoMicronesiaMiddle AfricaMoldovaMoroccoNepalNetherlandsNicaraguaNigeriaNorth AmericaNorth MacedoniaNorthern AfricaNorthern EuropeNorwayOceaniaPakistanPanamaPeruPhilippinesPolandPortugalRomaniaRussiaSaudi ArabiaScotlandSenegalSerbiaSierra LeoneSingaporeSomaliaSouth AfricaSouth AmericaSouth Central AsiaSouth Eastern AsiaSouthern EuropeSpainSri LankaSt. Vincent and the GrenadinesSudanSwedenSwitzerlandSyriaTaiwanThailandTrinidad and TobagoTurkeyUgandaUkraineUruguayUzbekistanVenezuelaVietnamWest IndiesWestern AfricaWestern AsiaWestern EuropeYemenZaireZimbabweAzores
Wage/Income Gap
Income
Poverty
Unemployment
Labor Participation
Family Structure
Vehicle Availability
Education Level
Disability

Laotian Wage/Income Gap
Average

25.2%
WAGE/INCOME GAP
59.3/ 100
METRIC RATING
135th/ 347
METRIC RANK

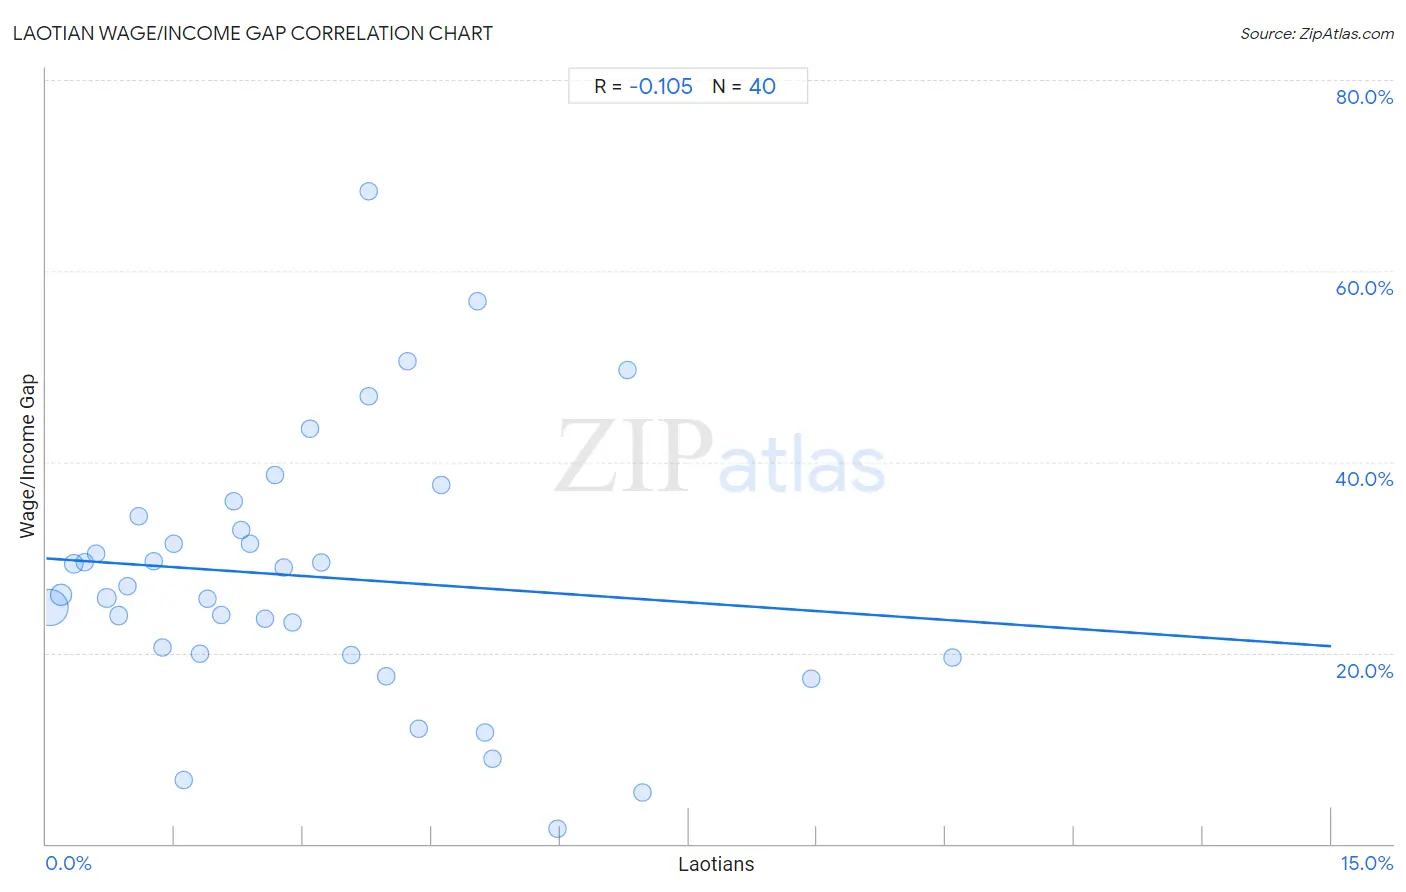
Laotian Wage/Income Gap Correlation Chart

The statistical analysis conducted on geographies consisting of 223,954,220 people shows a mild positive correlation between the proportion of Laotians and wage/income gap percentage in the United States with a correlation coefficient (R) of 0.353 and weighted average of 25.2%. On average, for every 1% (one percent) increase in Laotians within a typical geography, there is an increase of 0.87% in wage/income gap percentage.
Laotian Wage/Income Gap
It is essential to understand that the correlation between the percentage of Laotians and wage/income gap percentage does not imply a direct cause-and-effect relationship. It remains uncertain whether the presence of Laotians influences an upward or downward trend in the level of wage/income gap percentage within an area, or if Laotians simply ended up residing in those areas with higher or lower levels of wage/income gap percentage due to other factors.

Demographics Similar to Laotians by Wage/Income Gap

In terms of wage/income gap, the demographic groups most similar to Laotians are Immigrants from South Eastern Asia (25.1%, a difference of 0.11%), Immigrants from Philippines (25.1%, a difference of 0.14%), Soviet Union (25.2%, a difference of 0.19%), Afghan (25.2%, a difference of 0.22%), and Immigrants from Uruguay (25.1%, a difference of 0.28%).
DemographicsRating | RankWage/Income Gap
Immigrants from Central America
60.2
/100
|
#128
Good
25.0%
Mexican American Indians
60.1
/100
|
#129
Good
25.0%
Immigrants from Uganda
60.0
/100
|
#130
Good
25.0%
South Americans
60.0
/100
|
#131
Average
25.0%
Immigrants from Uruguay
59.6
/100
|
#132
Average
25.1%
Immigrants from Philippines
59.4
/100
|
#133
Average
25.1%
Immigrants from South Eastern Asia
59.4
/100
|
#134
Average
25.1%
Laotians
59.3
/100
|
#135
Average
25.2%
Soviet Union
59.1
/100
|
#136
Average
25.2%
Afghans
59.0
/100
|
#137
Average
25.2%
Immigrants from Costa Rica
58.9
/100
|
#138
Average
25.3%
Immigrants from Peru
58.9
/100
|
#139
Average
25.3%
Natives/Alaskans
58.8
/100
|
#140
Average
25.3%
Hispanics or Latinos
58.7
/100
|
#141
Average
25.3%
Immigrants from Bosnia and Herzegovina
58.4
/100
|
#142
Average
25.4%

Laotian Wage/Income Gap Correlation Summary

MeasurementLaotian DataWage/Income Gap Data
Minimum0.049%0.025%
Maximum27.1%75.0%
Range27.0%74.9%
Mean5.5%27.5%
Median4.5%25.1%
Interquartile 25% (IQ1)2.2%22.6%
Interquartile 75% (IQ3)6.9%28.1%
Interquartile Range (IQR)4.8%5.4%
Standard Deviation (Sample)5.0%12.3%
Standard Deviation (Population)4.9%12.2%

Correlation Details

Laotian PercentileSample SizeWage/Income Gap
[
0.0%
-
0.5%
]
0.049%
140,315,84324.4%
[
0.0%
-
0.5%
]
0.19%
37,236,13026.3%
[
0.0%
-
0.5%
]
0.33%
16,014,31726.3%
[
0.0%
-
0.5%
]
0.47%
10,309,46025.8%
[
0.5%
-
1.0%
]
0.60%
4,757,88525.9%
[
0.5%
-
1.0%
]
0.73%
3,506,54823.6%
[
0.5%
-
1.0%
]
0.87%
2,563,40125.7%
[
1.0%
-
1.5%
]
1.02%
2,259,78623.5%
[
1.0%
-
1.5%
]
1.16%
1,657,57322.5%
[
1.0%
-
1.5%
]
1.29%
583,35425.1%
[
1.0%
-
1.5%
]
1.43%
785,56523.9%
[
1.5%
-
2.0%
]
1.54%
696,42225.7%
[
1.5%
-
2.0%
]
1.69%
470,22923.3%
[
1.5%
-
2.0%
]
1.84%
450,71223.5%
[
1.5%
-
2.0%
]
1.94%
339,94826.7%
[
2.0%
-
2.5%
]
2.10%
370,41822.8%
[
2.0%
-
2.5%
]
2.23%
203,98123.0%
[
2.0%
-
2.5%
]
2.35%
151,38024.5%
[
2.5%
-
3.0%
]
2.51%
83,30023.1%
[
2.5%
-
3.0%
]
2.65%
252,32227.1%
[
2.5%
-
3.0%
]
2.74%
161,16827.7%
[
2.5%
-
3.0%
]
2.90%
250,59527.7%
[
3.0%
-
3.5%
]
3.02%
24,99825.2%
[
3.0%
-
3.5%
]
3.20%
23,62611.7%
[
3.0%
-
3.5%
]
3.32%
38,23022.2%
[
3.0%
-
3.5%
]
3.42%
60,09428.1%
[
3.5%
-
4.0%
]
3.59%
152,58226.3%
[
3.5%
-
4.0%
]
3.69%
15,56920.6%
[
3.5%
-
4.0%
]
3.87%
12,04116.6%
[
3.5%
-
4.0%
]
4.00%
7,63337.7%
[
4.0%
-
4.5%
]
4.15%
1,51826.0%
[
4.0%
-
4.5%
]
4.41%
32,72024.6%
[
4.5%
-
5.0%
]
4.57%
18,95932.8%
[
4.5%
-
5.0%
]
4.70%
3,48759.6%
[
4.5%
-
5.0%
]
4.82%
31160.2%
[
4.5%
-
5.0%
]
4.90%
3,77530.9%
[
5.0%
-
5.5%
]
5.11%
12,57530.3%
[
5.0%
-
5.5%
]
5.25%
29,80517.8%
[
5.0%
-
5.5%
]
5.31%
5,08030.8%
[
5.5%
-
6.0%
]
5.52%
52522.8%
[
5.5%
-
6.0%
]
5.82%
55036.0%
[
5.5%
-
6.0%
]
5.90%
3,61224.6%
[
6.0%
-
6.5%
]
6.05%
82613.5%
[
6.0%
-
6.5%
]
6.20%
22,59228.0%
[
6.0%
-
6.5%
]
6.25%
2,99011.2%
[
6.5%
-
7.0%
]
6.57%
2,4980.025%
[
6.5%
-
7.0%
]
6.75%
3,34722.9%
[
6.5%
-
7.0%
]
6.80%
14721.3%
[
7.0%
-
7.5%
]
7.08%
15,47220.6%
[
7.0%
-
7.5%
]
7.48%
1,69721.5%
[
7.5%
-
8.0%
]
7.69%
16920.6%
[
7.5%
-
8.0%
]
7.89%
13,78219.9%
[
8.0%
-
8.5%
]
8.24%
26728.1%
[
8.0%
-
8.5%
]
8.44%
86550.0%
[
8.5%
-
9.0%
]
8.68%
2,79934.4%
[
9.0%
-
9.5%
]
9.47%
2,61950.9%
[
10.0%
-
10.5%
]
10.34%
20326.9%
[
11.0%
-
11.5%
]
11.33%
2,14430.7%
[
11.5%
-
12.0%
]
11.80%
5,91512.9%
[
12.0%
-
12.5%
]
12.40%
1,95245.6%
[
13.5%
-
14.0%
]
13.93%
51756.6%
[
16.5%
-
17.0%
]
16.80%
3,50523.2%
[
22.0%
-
22.5%
]
22.29%
1,35514.3%
[
27.0%
-
27.5%
]
27.07%
53275.0%