Ecuadorian Wage/Income Gap
COMPARE
Ecuadorian
Select to Compare
Wage/Income Gap
Ecuadorian Wage/Income Gap
22.9%
WAGE/INCOME GAP
99.9/ 100
METRIC RATING
76th/ 347
METRIC RANK
Ecuadorian Wage/Income Gap Correlation Chart
The statistical analysis conducted on geographies consisting of 317,709,562 people shows a mild positive correlation between the proportion of Ecuadorians and wage/income gap percentage in the United States with a correlation coefficient (R) of 0.358 and weighted average of 22.9%. On average, for every 1% (one percent) increase in Ecuadorians within a typical geography, there is an increase of 0.51% in wage/income gap percentage.
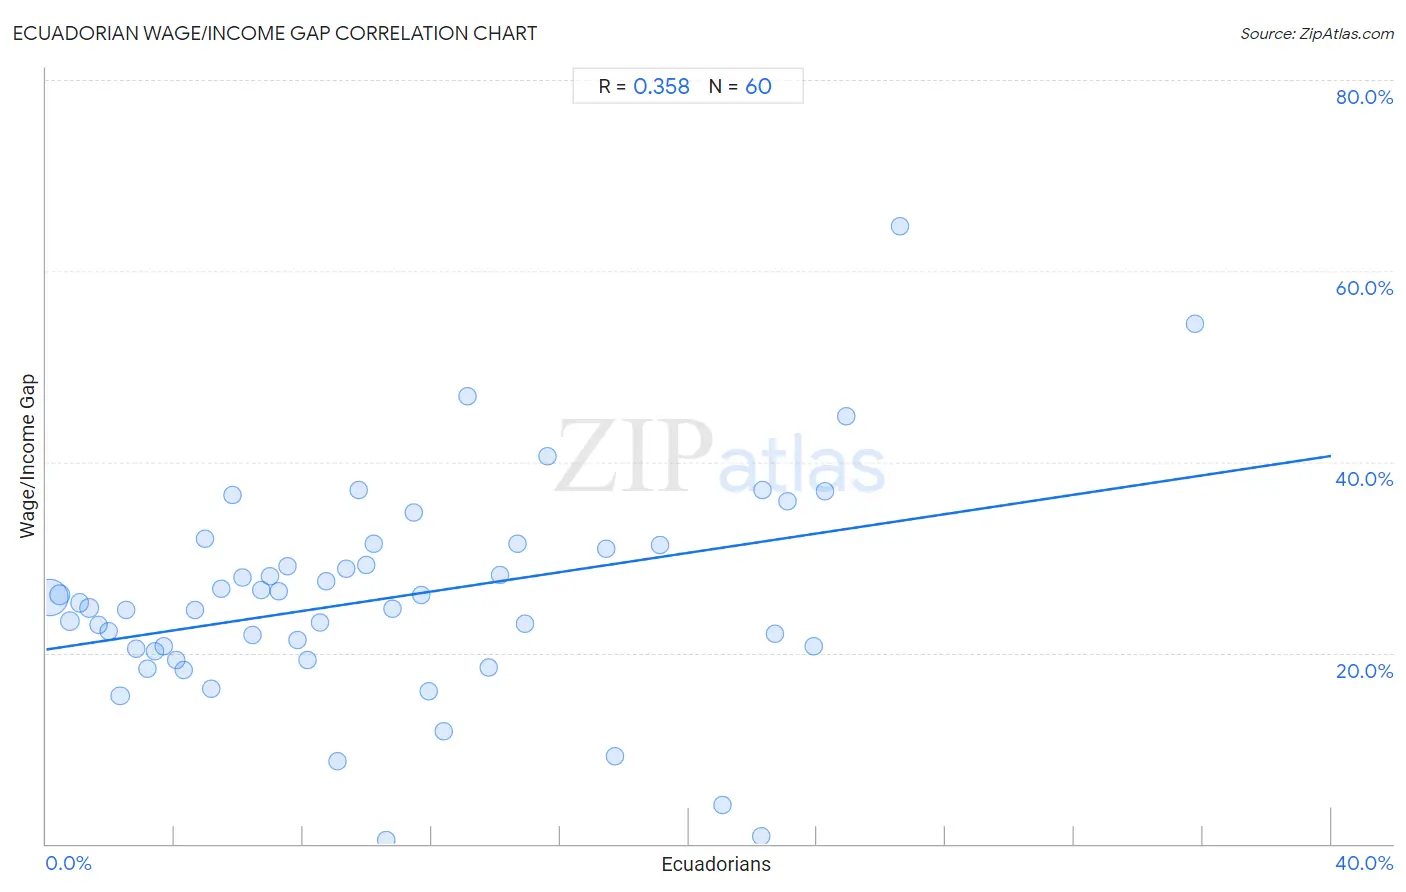
It is essential to understand that the correlation between the percentage of Ecuadorians and wage/income gap percentage does not imply a direct cause-and-effect relationship. It remains uncertain whether the presence of Ecuadorians influences an upward or downward trend in the level of wage/income gap percentage within an area, or if Ecuadorians simply ended up residing in those areas with higher or lower levels of wage/income gap percentage due to other factors.
Demographics Similar to Ecuadorians by Wage/Income Gap
In terms of wage/income gap, the demographic groups most similar to Ecuadorians are Fijian (22.9%, a difference of 0.010%), African (22.9%, a difference of 0.13%), Nigerian (23.0%, a difference of 0.24%), Immigrants from Burma/Myanmar (22.8%, a difference of 0.30%), and Immigrants from Nicaragua (23.0%, a difference of 0.33%).
| Demographics | Rating | Rank | Wage/Income Gap |
| Indonesians | 99.9 /100 | #69 | Exceptional 22.7% |
| Immigrants from Uzbekistan | 99.9 /100 | #70 | Exceptional 22.7% |
| Immigrants from El Salvador | 99.9 /100 | #71 | Exceptional 22.8% |
| Sub-Saharan Africans | 99.9 /100 | #72 | Exceptional 22.8% |
| Immigrants from Eastern Africa | 99.9 /100 | #73 | Exceptional 22.8% |
| Immigrants from Burma/Myanmar | 99.9 /100 | #74 | Exceptional 22.8% |
| Fijians | 99.9 /100 | #75 | Exceptional 22.9% |
| Ecuadorians | 99.9 /100 | #76 | Exceptional 22.9% |
| Africans | 99.9 /100 | #77 | Exceptional 22.9% |
| Nigerians | 99.9 /100 | #78 | Exceptional 23.0% |
| Immigrants from Nicaragua | 99.9 /100 | #79 | Exceptional 23.0% |
| Salvadorans | 99.9 /100 | #80 | Exceptional 23.0% |
| Bermudans | 99.8 /100 | #81 | Exceptional 23.1% |
| Central Americans | 99.8 /100 | #82 | Exceptional 23.1% |
| Immigrants from Africa | 99.8 /100 | #83 | Exceptional 23.2% |
Ecuadorian Wage/Income Gap Correlation Summary
| Measurement | Ecuadorian Data | Wage/Income Gap Data |
| Minimum | 0.10% | 0.44% |
| Maximum | 35.8% | 64.7% |
| Range | 35.7% | 64.2% |
| Mean | 10.6% | 25.7% |
| Median | 8.9% | 25.0% |
| Interquartile 25% (IQ1) | 4.5% | 20.3% |
| Interquartile 75% (IQ3) | 14.8% | 31.1% |
| Interquartile Range (IQR) | 10.3% | 10.8% |
| Standard Deviation (Sample) | 8.0% | 11.3% |
| Standard Deviation (Population) | 7.9% | 11.2% |
Correlation Details
| Ecuadorian Percentile | Sample Size | Wage/Income Gap |
[ 0.0% - 0.5% ] 0.10% | 225,932,486 | 25.8% |
[ 0.0% - 0.5% ] 0.42% | 35,419,830 | 26.1% |
[ 0.5% - 1.0% ] 0.74% | 18,226,764 | 23.3% |
[ 1.0% - 1.5% ] 1.03% | 7,913,517 | 25.2% |
[ 1.0% - 1.5% ] 1.33% | 4,828,141 | 24.7% |
[ 1.5% - 2.0% ] 1.64% | 3,859,145 | 22.9% |
[ 1.5% - 2.0% ] 1.93% | 1,924,887 | 22.2% |
[ 2.0% - 2.5% ] 2.29% | 10,137,881 | 15.5% |
[ 2.0% - 2.5% ] 2.49% | 1,886,245 | 24.5% |
[ 2.5% - 3.0% ] 2.82% | 1,067,580 | 20.4% |
[ 3.0% - 3.5% ] 3.16% | 1,009,736 | 18.4% |
[ 3.0% - 3.5% ] 3.39% | 700,275 | 20.2% |
[ 3.5% - 4.0% ] 3.68% | 275,525 | 20.7% |
[ 4.0% - 4.5% ] 4.04% | 204,286 | 19.3% |
[ 4.0% - 4.5% ] 4.28% | 369,136 | 18.2% |
[ 4.5% - 5.0% ] 4.62% | 297,502 | 24.4% |
[ 4.5% - 5.0% ] 4.94% | 75,070 | 31.9% |
[ 5.0% - 5.5% ] 5.12% | 295,399 | 16.2% |
[ 5.0% - 5.5% ] 5.45% | 96,831 | 26.7% |
[ 5.5% - 6.0% ] 5.79% | 75,504 | 36.6% |
[ 6.0% - 6.5% ] 6.10% | 158,067 | 27.9% |
[ 6.0% - 6.5% ] 6.41% | 105,683 | 21.8% |
[ 6.5% - 7.0% ] 6.71% | 199,062 | 26.6% |
[ 6.5% - 7.0% ] 6.97% | 101,959 | 28.1% |
[ 7.0% - 7.5% ] 7.25% | 222,817 | 26.4% |
[ 7.5% - 8.0% ] 7.52% | 183,067 | 29.0% |
[ 7.5% - 8.0% ] 7.83% | 150,353 | 21.4% |
[ 8.0% - 8.5% ] 8.12% | 107,043 | 19.2% |
[ 8.5% - 9.0% ] 8.53% | 156,526 | 23.2% |
[ 8.5% - 9.0% ] 8.72% | 334,815 | 27.5% |
[ 9.0% - 9.5% ] 9.07% | 31,554 | 8.6% |
[ 9.0% - 9.5% ] 9.34% | 12,343 | 28.8% |
[ 9.5% - 10.0% ] 9.74% | 51,505 | 37.0% |
[ 9.5% - 10.0% ] 9.96% | 222,377 | 29.1% |
[ 10.0% - 10.5% ] 10.20% | 32,963 | 31.4% |
[ 10.5% - 11.0% ] 10.58% | 91,516 | 0.44% |
[ 10.5% - 11.0% ] 10.78% | 86,963 | 24.6% |
[ 11.0% - 11.5% ] 11.43% | 22,800 | 34.7% |
[ 11.5% - 12.0% ] 11.65% | 127,356 | 26.0% |
[ 11.5% - 12.0% ] 11.90% | 111,707 | 16.0% |
[ 12.0% - 12.5% ] 12.37% | 100,539 | 11.8% |
[ 13.0% - 13.5% ] 13.11% | 9,461 | 46.9% |
[ 13.5% - 14.0% ] 13.79% | 111,475 | 18.4% |
[ 14.0% - 14.5% ] 14.12% | 70,070 | 28.2% |
[ 14.5% - 15.0% ] 14.65% | 41,907 | 31.4% |
[ 14.5% - 15.0% ] 14.88% | 27,076 | 23.1% |
[ 15.5% - 16.0% ] 15.59% | 9,126 | 40.6% |
[ 17.0% - 17.5% ] 17.43% | 11,777 | 30.9% |
[ 17.5% - 18.0% ] 17.72% | 1,078 | 9.1% |
[ 19.0% - 19.5% ] 19.11% | 21,040 | 31.3% |
[ 21.0% - 21.5% ] 21.04% | 1,231 | 4.1% |
[ 22.0% - 22.5% ] 22.25% | 5,164 | 0.78% |
[ 22.0% - 22.5% ] 22.28% | 1,077 | 37.0% |
[ 22.5% - 23.0% ] 22.68% | 5,587 | 22.0% |
[ 23.0% - 23.5% ] 23.08% | 1,005 | 35.9% |
[ 23.5% - 24.0% ] 23.90% | 112,750 | 20.7% |
[ 24.0% - 24.5% ] 24.24% | 56,696 | 36.9% |
[ 24.5% - 25.0% ] 24.90% | 9,162 | 44.8% |
[ 26.5% - 27.0% ] 26.59% | 4,407 | 64.7% |
[ 35.5% - 36.0% ] 35.76% | 2,718 | 54.5% |