Immigrants from Southern Europe Wage/Income Gap
COMPARE
Immigrants from Southern Europe
Select to Compare
Wage/Income Gap
Immigrants from Southern Europe Wage/Income Gap
26.4%
WAGE/INCOME GAP
17.3/ 100
METRIC RATING
205th/ 347
METRIC RANK
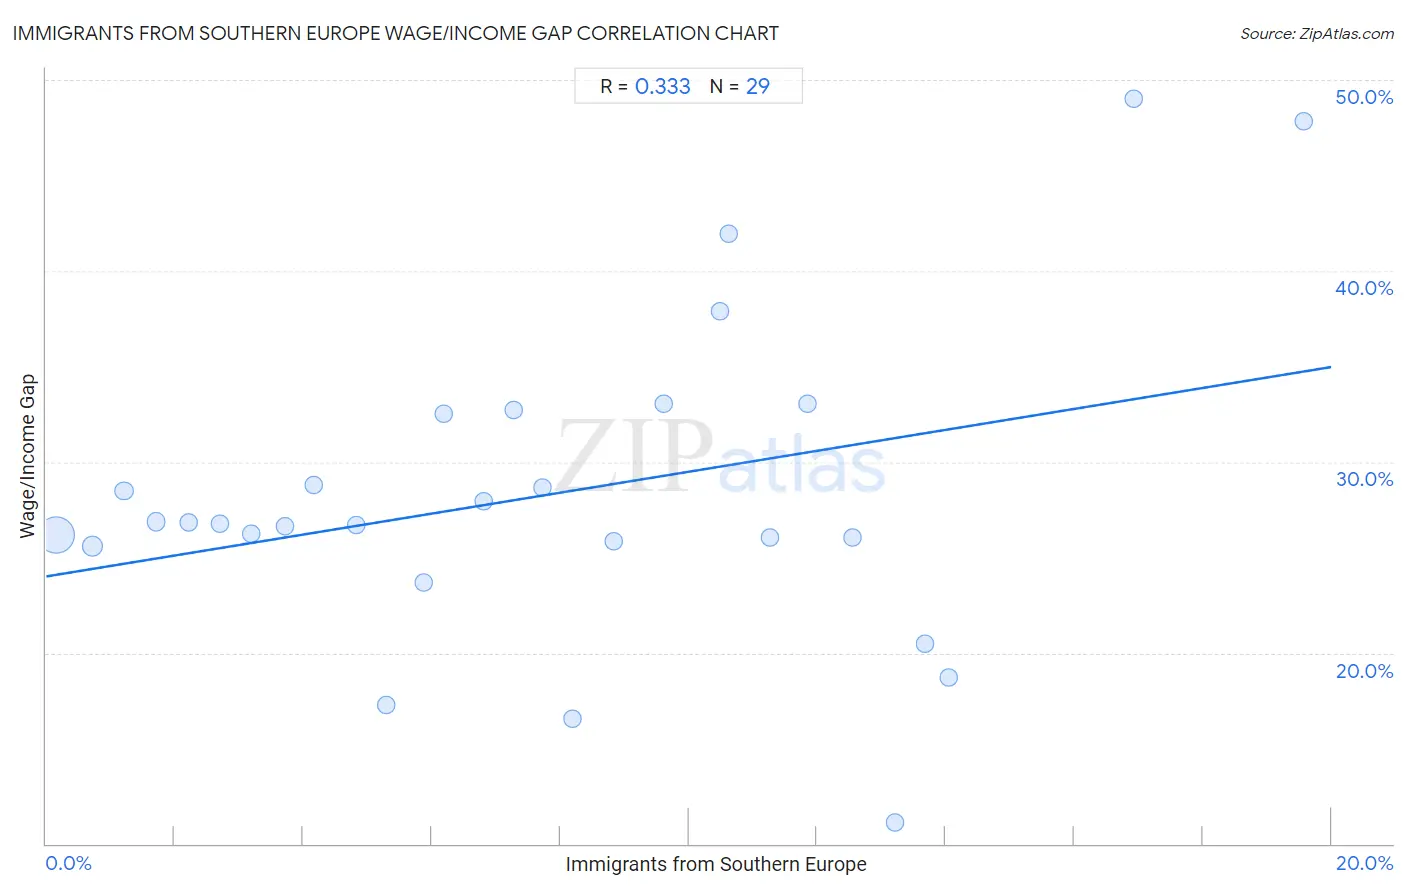
Immigrants from Southern Europe Wage/Income Gap Correlation Chart
The statistical analysis conducted on geographies consisting of 402,480,868 people shows a mild positive correlation between the proportion of Immigrants from Southern Europe and wage/income gap percentage in the United States with a correlation coefficient (R) of 0.333 and weighted average of 26.4%. On average, for every 1% (one percent) increase in Immigrants from Southern Europe within a typical geography, there is an increase of 0.55% in wage/income gap percentage.
It is essential to understand that the correlation between the percentage of Immigrants from Southern Europe and wage/income gap percentage does not imply a direct cause-and-effect relationship. It remains uncertain whether the presence of Immigrants from Southern Europe influences an upward or downward trend in the level of wage/income gap percentage within an area, or if Immigrants from Southern Europe simply ended up residing in those areas with higher or lower levels of wage/income gap percentage due to other factors.
Demographics Similar to Immigrants from Southern Europe by Wage/Income Gap
In terms of wage/income gap, the demographic groups most similar to Immigrants from Southern Europe are Indian (Asian) (26.4%, a difference of 0.090%), Immigrants from Italy (26.5%, a difference of 0.17%), Immigrants from Russia (26.4%, a difference of 0.18%), Laotian (26.4%, a difference of 0.20%), and Immigrants from Eastern Europe (26.4%, a difference of 0.20%).
| Demographics | Rating | Rank | Wage/Income Gap |
| Venezuelans | 21.5 /100 | #198 | Fair 26.3% |
| Dutch West Indians | 21.0 /100 | #199 | Fair 26.3% |
| Delaware | 20.9 /100 | #200 | Fair 26.3% |
| Immigrants from Syria | 19.3 /100 | #201 | Poor 26.4% |
| Laotians | 19.2 /100 | #202 | Poor 26.4% |
| Immigrants from Eastern Europe | 19.2 /100 | #203 | Poor 26.4% |
| Immigrants from Russia | 19.0 /100 | #204 | Poor 26.4% |
| Immigrants from Southern Europe | 17.3 /100 | #205 | Poor 26.4% |
| Indians (Asian) | 16.5 /100 | #206 | Poor 26.4% |
| Immigrants from Italy | 15.8 /100 | #207 | Poor 26.5% |
| Egyptians | 12.7 /100 | #208 | Poor 26.6% |
| Immigrants from Kuwait | 12.6 /100 | #209 | Poor 26.6% |
| Arabs | 12.3 /100 | #210 | Poor 26.6% |
| Mongolians | 11.4 /100 | #211 | Poor 26.6% |
| Iraqis | 11.2 /100 | #212 | Poor 26.6% |
Immigrants from Southern Europe Wage/Income Gap Correlation Summary
| Measurement | Immigrants from Southern Europe Data | Wage/Income Gap Data |
| Minimum | 0.15% | 11.1% |
| Maximum | 19.6% | 49.0% |
| Range | 19.4% | 37.9% |
| Mean | 7.7% | 28.2% |
| Median | 7.3% | 26.8% |
| Interquartile 25% (IQ1) | 3.5% | 25.7% |
| Interquartile 75% (IQ3) | 11.6% | 32.6% |
| Interquartile Range (IQR) | 8.1% | 6.9% |
| Standard Deviation (Sample) | 5.1% | 8.3% |
| Standard Deviation (Population) | 5.0% | 8.2% |
Correlation Details
| Immigrants from Southern Europe Percentile | Sample Size | Wage/Income Gap |
[ 0.0% - 0.5% ] 0.15% | 333,232,041 | 26.2% |
[ 0.5% - 1.0% ] 0.71% | 45,850,816 | 25.6% |
[ 1.0% - 1.5% ] 1.21% | 11,953,441 | 28.5% |
[ 1.5% - 2.0% ] 1.70% | 4,666,275 | 26.9% |
[ 2.0% - 2.5% ] 2.22% | 1,861,227 | 26.8% |
[ 2.5% - 3.0% ] 2.71% | 1,709,933 | 26.8% |
[ 3.0% - 3.5% ] 3.19% | 902,566 | 26.3% |
[ 3.5% - 4.0% ] 3.72% | 574,229 | 26.6% |
[ 4.0% - 4.5% ] 4.16% | 258,989 | 28.8% |
[ 4.5% - 5.0% ] 4.82% | 282,757 | 26.7% |
[ 5.0% - 5.5% ] 5.30% | 205,738 | 17.2% |
[ 5.5% - 6.0% ] 5.87% | 90,321 | 23.7% |
[ 6.0% - 6.5% ] 6.19% | 93,424 | 32.5% |
[ 6.5% - 7.0% ] 6.80% | 96,226 | 27.9% |
[ 7.0% - 7.5% ] 7.28% | 15,518 | 32.7% |
[ 7.5% - 8.0% ] 7.72% | 219,764 | 28.6% |
[ 8.0% - 8.5% ] 8.19% | 85,308 | 16.6% |
[ 8.5% - 9.0% ] 8.83% | 55,874 | 25.8% |
[ 9.5% - 10.0% ] 9.61% | 44,246 | 33.0% |
[ 10.0% - 10.5% ] 10.49% | 58,261 | 37.9% |
[ 10.5% - 11.0% ] 10.61% | 12,465 | 41.9% |
[ 11.0% - 11.5% ] 11.27% | 124,564 | 26.0% |
[ 11.5% - 12.0% ] 11.85% | 25,927 | 33.1% |
[ 12.5% - 13.0% ] 12.55% | 26,807 | 26.0% |
[ 13.0% - 13.5% ] 13.22% | 21,742 | 11.1% |
[ 13.5% - 14.0% ] 13.68% | 6,484 | 20.4% |
[ 14.0% - 14.5% ] 14.05% | 121 | 18.7% |
[ 16.5% - 17.0% ] 16.93% | 4,660 | 49.0% |
[ 19.5% - 20.0% ] 19.58% | 1,144 | 47.8% |