Iroquois Wage/Income Gap
COMPARE
Iroquois
Select to Compare
Wage/Income Gap
Iroquois Wage/Income Gap
25.1%
WAGE/INCOME GAP
83.9/ 100
METRIC RATING
148th/ 347
METRIC RANK
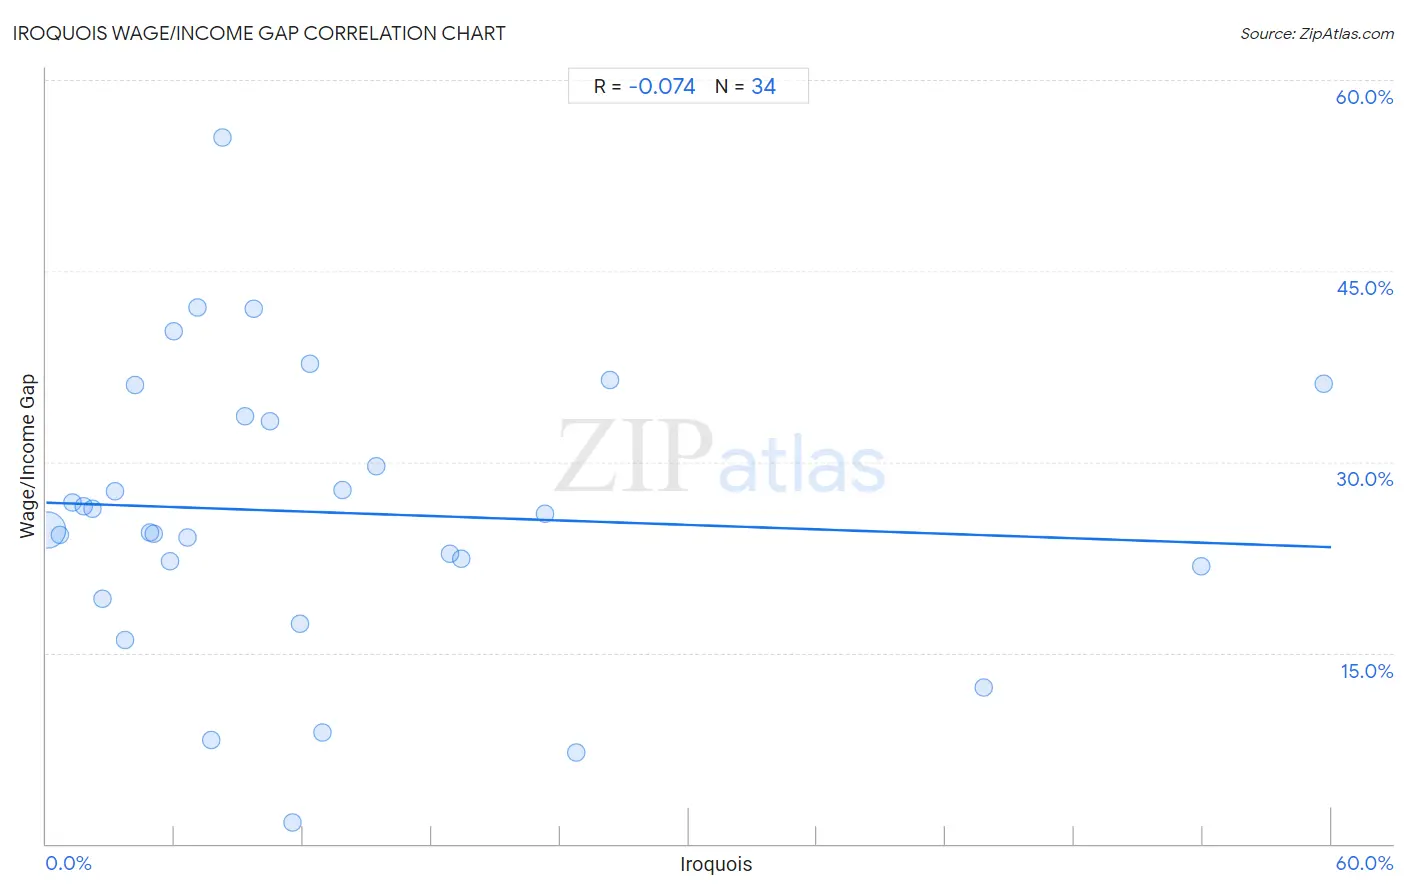
Iroquois Wage/Income Gap Correlation Chart
The statistical analysis conducted on geographies consisting of 207,171,754 people shows a slight negative correlation between the proportion of Iroquois and wage/income gap percentage in the United States with a correlation coefficient (R) of -0.074 and weighted average of 25.1%. On average, for every 1% (one percent) increase in Iroquois within a typical geography, there is a decrease of 0.058% in wage/income gap percentage.

It is essential to understand that the correlation between the percentage of Iroquois and wage/income gap percentage does not imply a direct cause-and-effect relationship. It remains uncertain whether the presence of Iroquois influences an upward or downward trend in the level of wage/income gap percentage within an area, or if Iroquois simply ended up residing in those areas with higher or lower levels of wage/income gap percentage due to other factors.
Demographics Similar to Iroquois by Wage/Income Gap
In terms of wage/income gap, the demographic groups most similar to Iroquois are Malaysian (25.0%, a difference of 0.14%), Immigrants from Peru (25.1%, a difference of 0.15%), Comanche (25.0%, a difference of 0.16%), South American (25.0%, a difference of 0.16%), and Immigrants (25.1%, a difference of 0.19%).
| Demographics | Rating | Rank | Wage/Income Gap |
| Hawaiians | 89.3 /100 | #141 | Excellent 24.9% |
| Afghans | 88.1 /100 | #142 | Excellent 24.9% |
| Immigrants from Uganda | 88.0 /100 | #143 | Excellent 24.9% |
| Chippewa | 86.9 /100 | #144 | Excellent 25.0% |
| Comanche | 85.2 /100 | #145 | Excellent 25.0% |
| South Americans | 85.2 /100 | #146 | Excellent 25.0% |
| Malaysians | 84.9 /100 | #147 | Excellent 25.0% |
| Iroquois | 83.9 /100 | #148 | Excellent 25.1% |
| Immigrants from Peru | 82.6 /100 | #149 | Excellent 25.1% |
| Immigrants | 82.3 /100 | #150 | Excellent 25.1% |
| Taiwanese | 81.6 /100 | #151 | Excellent 25.1% |
| Uruguayans | 81.3 /100 | #152 | Excellent 25.2% |
| Blackfeet | 78.1 /100 | #153 | Good 25.2% |
| Immigrants from Northern Africa | 78.1 /100 | #154 | Good 25.2% |
| Immigrants from Vietnam | 77.7 /100 | #155 | Good 25.2% |
Iroquois Wage/Income Gap Correlation Summary
| Measurement | Iroquois Data | Wage/Income Gap Data |
| Minimum | 0.054% | 1.6% |
| Maximum | 59.6% | 55.5% |
| Range | 59.6% | 53.9% |
| Mean | 13.2% | 26.0% |
| Median | 8.8% | 25.3% |
| Interquartile 25% (IQ1) | 4.1% | 21.8% |
| Interquartile 75% (IQ3) | 15.4% | 33.6% |
| Interquartile Range (IQR) | 11.2% | 11.8% |
| Standard Deviation (Sample) | 14.3% | 11.3% |
| Standard Deviation (Population) | 14.1% | 11.1% |
Correlation Details
| Iroquois Percentile | Sample Size | Wage/Income Gap |
[ 0.0% - 0.5% ] 0.054% | 203,044,771 | 24.7% |
[ 0.5% - 1.0% ] 0.65% | 2,838,999 | 24.3% |
[ 1.0% - 1.5% ] 1.21% | 564,772 | 26.8% |
[ 1.5% - 2.0% ] 1.73% | 215,028 | 26.5% |
[ 2.0% - 2.5% ] 2.14% | 293,466 | 26.3% |
[ 2.5% - 3.0% ] 2.61% | 35,123 | 19.3% |
[ 3.0% - 3.5% ] 3.19% | 49,877 | 27.7% |
[ 3.5% - 4.0% ] 3.67% | 37,770 | 16.0% |
[ 4.0% - 4.5% ] 4.14% | 10,673 | 36.0% |
[ 4.5% - 5.0% ] 4.84% | 5,334 | 24.4% |
[ 5.0% - 5.5% ] 5.03% | 1,711 | 24.4% |
[ 5.5% - 6.0% ] 5.80% | 1,913 | 22.2% |
[ 5.5% - 6.0% ] 5.94% | 10,130 | 40.2% |
[ 6.5% - 7.0% ] 6.57% | 746 | 24.0% |
[ 7.0% - 7.5% ] 7.07% | 1,470 | 42.1% |
[ 7.5% - 8.0% ] 7.72% | 272 | 8.1% |
[ 8.0% - 8.5% ] 8.25% | 1,345 | 55.5% |
[ 9.0% - 9.5% ] 9.28% | 6,186 | 33.6% |
[ 9.5% - 10.0% ] 9.67% | 11,548 | 42.0% |
[ 10.0% - 10.5% ] 10.46% | 4,367 | 33.2% |
[ 11.0% - 11.5% ] 11.49% | 505 | 1.6% |
[ 11.5% - 12.0% ] 11.84% | 1,681 | 17.3% |
[ 12.0% - 12.5% ] 12.32% | 2,207 | 37.7% |
[ 12.5% - 13.0% ] 12.90% | 1,202 | 8.8% |
[ 13.5% - 14.0% ] 13.82% | 1,976 | 27.8% |
[ 15.0% - 15.5% ] 15.38% | 650 | 29.6% |
[ 18.5% - 19.0% ] 18.85% | 12,805 | 22.7% |
[ 19.0% - 19.5% ] 19.37% | 506 | 22.4% |
[ 23.0% - 23.5% ] 23.26% | 2,218 | 25.9% |
[ 24.5% - 25.0% ] 24.74% | 2,910 | 7.1% |
[ 26.0% - 26.5% ] 26.31% | 1,600 | 36.4% |
[ 43.5% - 44.0% ] 43.75% | 128 | 12.3% |
[ 53.5% - 54.0% ] 53.93% | 4,196 | 21.8% |
[ 59.5% - 60.0% ] 59.63% | 3,669 | 36.2% |