Hmong Wage/Income Gap

COMPARE

Hmong
Race
Ancestry
AfghanAfricanAlaska NativeAlaskan AthabascanAlbanianAleutAlsatianAmericanApacheArabArapahoArgentineanArmenianAssyrian/Chaldean/SyriacAustralianAustrianBahamianBangladeshiBarbadianBasqueBelgianBelizeanBermudanBhutaneseBlackfeetBolivianBrazilianBritishBritish West IndianBulgarianBurmeseCajunCambodianCanadianCape VerdeanCarpatho RusynCelticCentral AmericanCentral American IndianCherokeeCheyenneChickasawChileanChineseChippewaChoctawColombianColvilleComancheCosta RicanCreeCreekCroatianCrowCubanCypriotCzechCzechoslovakianDanishDelawareDominicanDutchDutch West IndianEastern EuropeanEcuadorianEgyptianEnglishEstonianEthiopianEuropeanFijianFilipinoFinnishFrenchFrench American IndianFrench CanadianGermanGerman RussianGhanaianGreekGuamanian/ChamorroGuatemalanGuyaneseHaitianHmongHonduranHopiHoumaHungarianIcelanderIndian (Asian)IndonesianInupiatIranianIraqiIrishIroquoisIsraeliItalianJamaicanJapaneseJordanianKenyanKiowaKoreanLaotianLatvianLebaneseLiberianLithuanianLumbeeLuxembourgerMacedonianMalaysianMalteseMarshalleseMenomineeMexicanMexican American IndianMongolianMoroccanNative HawaiianNavajoNepaleseNew ZealanderNicaraguanNigerianNorthern EuropeanNorwegianOkinawanOsageOttawaPaiutePakistaniPalestinianPanamanianParaguayanPennsylvania GermanPeruvianPimaPolishPortuguesePotawatomiPuebloPuerto RicanPuget Sound SalishRomanianRussianSalvadoranSamoanScandinavianScotch-IrishScottishSeminoleSenegaleseSerbianShoshoneSierra LeoneanSiouxSlavicSlovakSloveneSomaliSouth AfricanSouth AmericanSouth American IndianSoviet UnionSpaniardSpanishSpanish AmericanSpanish American IndianSri LankanSubsaharan AfricanSudaneseSwedishSwissSyrianTaiwaneseThaiTlingit-HaidaTohono O'OdhamTonganTrinidadian and TobagonianTsimshianTurkishU.S. Virgin IslanderUgandanUkrainianUruguayanUteVenezuelanVietnameseWelshWest IndianYakamaYaquiYugoslavianYumanYup'ikZimbabwean
Immigration
NonimmigrantsImmigrantsAfghanistanAfricaAlbaniaArgentinaArmeniaAsiaAustraliaAustriaBahamasBangladeshBarbadosBelarusBelgiumBelizeBoliviaBosnia and HerzegovinaBrazilBulgariaBurma/MyanmarCabo VerdeCambodiaCameroonCanadaCaribbeanCentral AmericaChileChinaColombiaCongoCosta RicaCroatiaCubaCzechoslovakiaDenmarkDominicaDominican RepublicEastern AfricaEastern AsiaEastern EuropeEcuadorEgyptEl SalvadorEnglandEritreaEthiopiaEuropeFijiFranceGermanyGhanaGreeceGrenadaGuatemalaGuyanaHaitiHondurasHong KongHungaryIndiaIndonesiaIranIraqIrelandIsraelItalyJamaicaJapanJordanKazakhstanKenyaKoreaKuwaitLaosLatin AmericaLatviaLebanonLiberiaLithuaniaMalaysiaMexicoMicronesiaMiddle AfricaMoldovaMoroccoNepalNetherlandsNicaraguaNigeriaNorth AmericaNorth MacedoniaNorthern AfricaNorthern EuropeNorwayOceaniaPakistanPanamaPeruPhilippinesPolandPortugalRomaniaRussiaSaudi ArabiaScotlandSenegalSerbiaSierra LeoneSingaporeSomaliaSouth AfricaSouth AmericaSouth Central AsiaSouth Eastern AsiaSouthern EuropeSpainSri LankaSt. Vincent and the GrenadinesSudanSwedenSwitzerlandSyriaTaiwanThailandTrinidad and TobagoTurkeyUgandaUkraineUruguayUzbekistanVenezuelaVietnamWest IndiesWestern AfricaWestern AsiaWestern EuropeYemenZaireZimbabweAzores
Select to Compare
Race
Ancestry
AfghanAfricanAlaska NativeAlaskan AthabascanAlbanianAleutAlsatianAmericanApacheArabArapahoArgentineanArmenianAssyrian/Chaldean/SyriacAustralianAustrianBahamianBangladeshiBarbadianBasqueBelgianBelizeanBermudanBhutaneseBlackfeetBolivianBrazilianBritishBritish West IndianBulgarianBurmeseCajunCambodianCanadianCape VerdeanCarpatho RusynCelticCentral AmericanCentral American IndianCherokeeCheyenneChickasawChileanChineseChippewaChoctawColombianColvilleComancheCosta RicanCreeCreekCroatianCrowCubanCypriotCzechCzechoslovakianDanishDelawareDominicanDutchDutch West IndianEastern EuropeanEcuadorianEgyptianEnglishEstonianEthiopianEuropeanFijianFilipinoFinnishFrenchFrench American IndianFrench CanadianGermanGerman RussianGhanaianGreekGuamanian/ChamorroGuatemalanGuyaneseHaitianHonduranHopiHoumaHungarianIcelanderIndian (Asian)IndonesianInupiatIranianIraqiIrishIroquoisIsraeliItalianJamaicanJapaneseJordanianKenyanKiowaKoreanLaotianLatvianLebaneseLiberianLithuanianLumbeeLuxembourgerMacedonianMalaysianMalteseMarshalleseMenomineeMexicanMexican American IndianMongolianMoroccanNative HawaiianNavajoNepaleseNew ZealanderNicaraguanNigerianNorthern EuropeanNorwegianOkinawanOsageOttawaPaiutePakistaniPalestinianPanamanianParaguayanPennsylvania GermanPeruvianPimaPolishPortuguesePotawatomiPuebloPuerto RicanPuget Sound SalishRomanianRussianSalvadoranSamoanScandinavianScotch-IrishScottishSeminoleSenegaleseSerbianShoshoneSierra LeoneanSiouxSlavicSlovakSloveneSomaliSouth AfricanSouth AmericanSouth American IndianSoviet UnionSpaniardSpanishSpanish AmericanSpanish American IndianSri LankanSubsaharan AfricanSudaneseSwedishSwissSyrianTaiwaneseThaiTlingit-HaidaTohono O'OdhamTonganTrinidadian and TobagonianTsimshianTurkishU.S. Virgin IslanderUgandanUkrainianUruguayanUteVenezuelanVietnameseWelshWest IndianYakamaYaquiYugoslavianYumanYup'ikZimbabwean
Immigration
NonimmigrantsImmigrantsAfghanistanAfricaAlbaniaArgentinaArmeniaAsiaAustraliaAustriaBahamasBangladeshBarbadosBelarusBelgiumBelizeBoliviaBosnia and HerzegovinaBrazilBulgariaBurma/MyanmarCabo VerdeCambodiaCameroonCanadaCaribbeanCentral AmericaChileChinaColombiaCongoCosta RicaCroatiaCubaCzechoslovakiaDenmarkDominicaDominican RepublicEastern AfricaEastern AsiaEastern EuropeEcuadorEgyptEl SalvadorEnglandEritreaEthiopiaEuropeFijiFranceGermanyGhanaGreeceGrenadaGuatemalaGuyanaHaitiHondurasHong KongHungaryIndiaIndonesiaIranIraqIrelandIsraelItalyJamaicaJapanJordanKazakhstanKenyaKoreaKuwaitLaosLatin AmericaLatviaLebanonLiberiaLithuaniaMalaysiaMexicoMicronesiaMiddle AfricaMoldovaMoroccoNepalNetherlandsNicaraguaNigeriaNorth AmericaNorth MacedoniaNorthern AfricaNorthern EuropeNorwayOceaniaPakistanPanamaPeruPhilippinesPolandPortugalRomaniaRussiaSaudi ArabiaScotlandSenegalSerbiaSierra LeoneSingaporeSomaliaSouth AfricaSouth AmericaSouth Central AsiaSouth Eastern AsiaSouthern EuropeSpainSri LankaSt. Vincent and the GrenadinesSudanSwedenSwitzerlandSyriaTaiwanThailandTrinidad and TobagoTurkeyUgandaUkraineUruguayUzbekistanVenezuelaVietnamWest IndiesWestern AfricaWestern AsiaWestern EuropeYemenZaireZimbabweAzores
Wage/Income Gap
Income
Poverty
Unemployment
Labor Participation
Family Structure
Vehicle Availability
Education Level
Disability

Hmong Wage/Income Gap
Good

22.2%
WAGE/INCOME GAP
72.8/ 100
METRIC RATING
52nd/ 347
METRIC RANK

Hmong Wage/Income Gap Correlation Chart

The statistical analysis conducted on geographies consisting of 135,421,678 people shows a moderate negative correlation between the proportion of Hmong and wage/income gap percentage in the United States with a correlation coefficient (R) of -0.433 and weighted average of 22.2%. On average, for every 1% (one percent) increase in Hmong within a typical geography, there is a decrease of 0.32% in wage/income gap percentage.
Hmong Wage/Income Gap
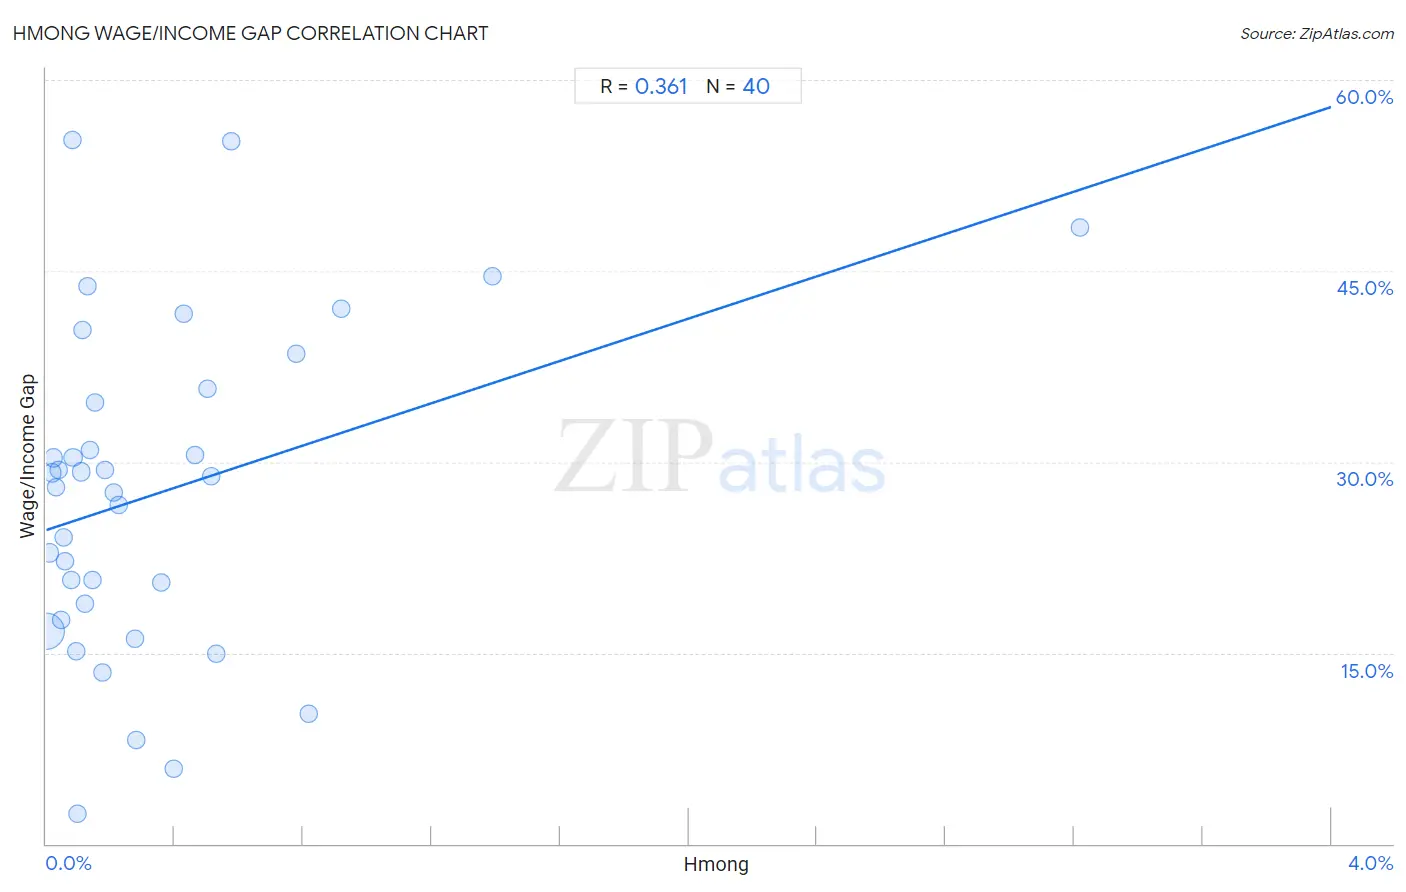
It is essential to understand that the correlation between the percentage of Hmong and wage/income gap percentage does not imply a direct cause-and-effect relationship. It remains uncertain whether the presence of Hmong influences an upward or downward trend in the level of wage/income gap percentage within an area, or if Hmong simply ended up residing in those areas with higher or lower levels of wage/income gap percentage due to other factors.

Demographics Similar to Hmong by Wage/Income Gap

In terms of wage/income gap, the demographic groups most similar to Hmong are Immigrants from Ghana (22.3%, a difference of 0.27%), Ghanaian (22.3%, a difference of 0.33%), Lumbee (22.3%, a difference of 0.51%), Immigrants from Cuba (22.1%, a difference of 0.56%), and Ethiopian (22.0%, a difference of 1.1%).
DemographicsRating | RankWage/Income Gap
Immigrants from Ethiopia
75.6
/100
|
#45
Good
21.6%
Blacks/African Americans
74.9
/100
|
#46
Good
21.7%
Yuman
74.2
/100
|
#47
Good
21.9%
Immigrants from Congo
74.1
/100
|
#48
Good
21.9%
Immigrants from Western Africa
74.0
/100
|
#49
Good
21.9%
Ethiopians
73.9
/100
|
#50
Good
22.0%
Immigrants from Cuba
73.4
/100
|
#51
Good
22.1%
Hmong
72.8
/100
|
#52
Good
22.2%
Immigrants from Ghana
72.6
/100
|
#53
Good
22.3%
Ghanaians
72.5
/100
|
#54
Good
22.3%
Lumbee
72.3
/100
|
#55
Good
22.3%
Crow
71.8
/100
|
#56
Good
22.4%
Immigrants from Cameroon
71.5
/100
|
#57
Good
22.5%
Immigrants from Nigeria
71.2
/100
|
#58
Good
22.6%
Navajo
71.1
/100
|
#59
Good
22.6%

Hmong Wage/Income Gap Correlation Summary

MeasurementHmong DataWage/Income Gap Data
Minimum0.061%6.5%
Maximum56.2%41.8%
Range56.1%35.3%
Mean10.8%21.7%
Median8.8%22.9%
Interquartile 25% (IQ1)4.4%16.3%
Interquartile 75% (IQ3)13.9%26.7%
Interquartile Range (IQR)9.5%10.4%
Standard Deviation (Sample)10.0%7.3%
Standard Deviation (Population)9.9%7.3%

Correlation Details

Hmong PercentileSample SizeWage/Income Gap
[
0.0%
-
0.5%
]
0.061%
110,684,65923.8%
[
0.0%
-
0.5%
]
0.48%
8,316,80628.0%
[
0.5%
-
1.0%
]
0.84%
3,010,61327.1%
[
1.0%
-
1.5%
]
1.21%
1,864,22125.3%
[
1.5%
-
2.0%
]
1.53%
1,910,41824.7%
[
1.5%
-
2.0%
]
1.95%
2,382,91621.2%
[
2.0%
-
2.5%
]
2.27%
870,02425.2%
[
2.5%
-
3.0%
]
2.61%
694,17127.4%
[
2.5%
-
3.0%
]
2.98%
461,34426.3%
[
3.0%
-
3.5%
]
3.29%
1,102,14119.2%
[
3.5%
-
4.0%
]
3.70%
359,31626.1%
[
3.5%
-
4.0%
]
3.93%
131,66026.7%
[
4.0%
-
4.5%
]
4.39%
128,58027.9%
[
4.5%
-
5.0%
]
4.75%
316,13426.6%
[
5.0%
-
5.5%
]
5.02%
808,20421.8%
[
5.0%
-
5.5%
]
5.44%
83,01931.8%
[
5.5%
-
6.0%
]
5.68%
305,20624.3%
[
6.0%
-
6.5%
]
6.21%
173,96024.5%
[
6.0%
-
6.5%
]
6.44%
44,52129.7%
[
6.5%
-
7.0%
]
6.82%
107,81713.1%
[
7.0%
-
7.5%
]
7.10%
116,62728.5%
[
7.0%
-
7.5%
]
7.50%
53,67031.9%
[
8.0%
-
8.5%
]
8.00%
22541.8%
[
8.0%
-
8.5%
]
8.25%
33,77416.0%
[
8.5%
-
9.0%
]
8.54%
73,76718.5%
[
9.0%
-
9.5%
]
9.01%
82,13914.7%
[
9.0%
-
9.5%
]
9.39%
23,30432.1%
[
9.5%
-
10.0%
]
9.65%
95,27221.0%
[
9.5%
-
10.0%
]
9.89%
5,20831.6%
[
10.0%
-
10.5%
]
10.31%
119,21617.6%
[
10.5%
-
11.0%
]
10.65%
126,43518.1%
[
10.5%
-
11.0%
]
10.87%
71,74029.0%
[
11.0%
-
11.5%
]
11.43%
311,84514.0%
[
11.5%
-
12.0%
]
11.97%
125,21019.4%
[
12.0%
-
12.5%
]
12.28%
33,20723.1%
[
12.5%
-
13.0%
]
12.58%
7397.5%
[
12.5%
-
13.0%
]
12.99%
92,60222.8%
[
13.5%
-
14.0%
]
13.86%
13,3308.1%
[
14.0%
-
14.5%
]
14.05%
44,43013.1%
[
14.0%
-
14.5%
]
14.43%
46,74314.5%
[
15.0%
-
15.5%
]
15.41%
41,67318.8%
[
16.0%
-
16.5%
]
16.31%
96911.5%
[
16.5%
-
17.0%
]
16.89%
52,20216.3%
[
20.0%
-
20.5%
]
20.15%
13,44623.4%
[
22.0%
-
22.5%
]
22.31%
7,38610.0%
[
23.0%
-
23.5%
]
23.10%
1,11723.0%
[
25.5%
-
26.0%
]
25.57%
59,1976.5%
[
27.0%
-
27.5%
]
27.43%
19,60614.3%
[
36.0%
-
36.5%
]
36.49%
70719.3%
[
56.0%
-
56.5%
]
56.17%
16217.0%