Costa Rican Wage/Income Gap

COMPARE

Costa Rican
Race
Ancestry
AfghanAfricanAlaska NativeAlaskan AthabascanAlbanianAleutAlsatianAmericanApacheArabArapahoArgentineanArmenianAssyrian/Chaldean/SyriacAustralianAustrianBahamianBangladeshiBarbadianBasqueBelgianBelizeanBermudanBhutaneseBlackfeetBolivianBrazilianBritishBritish West IndianBulgarianBurmeseCajunCambodianCanadianCape VerdeanCarpatho RusynCelticCentral AmericanCentral American IndianCherokeeCheyenneChickasawChileanChineseChippewaChoctawColombianColvilleComancheCosta RicanCreeCreekCroatianCrowCubanCypriotCzechCzechoslovakianDanishDelawareDominicanDutchDutch West IndianEastern EuropeanEcuadorianEgyptianEnglishEstonianEthiopianEuropeanFijianFilipinoFinnishFrenchFrench American IndianFrench CanadianGermanGerman RussianGhanaianGreekGuamanian/ChamorroGuatemalanGuyaneseHaitianHmongHonduranHopiHoumaHungarianIcelanderIndian (Asian)IndonesianInupiatIranianIraqiIrishIroquoisIsraeliItalianJamaicanJapaneseJordanianKenyanKiowaKoreanLaotianLatvianLebaneseLiberianLithuanianLumbeeLuxembourgerMacedonianMalaysianMalteseMarshalleseMenomineeMexicanMexican American IndianMongolianMoroccanNative HawaiianNavajoNepaleseNew ZealanderNicaraguanNigerianNorthern EuropeanNorwegianOkinawanOsageOttawaPaiutePakistaniPalestinianPanamanianParaguayanPennsylvania GermanPeruvianPimaPolishPortuguesePotawatomiPuebloPuerto RicanPuget Sound SalishRomanianRussianSalvadoranSamoanScandinavianScotch-IrishScottishSeminoleSenegaleseSerbianShoshoneSierra LeoneanSiouxSlavicSlovakSloveneSomaliSouth AfricanSouth AmericanSouth American IndianSoviet UnionSpaniardSpanishSpanish AmericanSpanish American IndianSri LankanSubsaharan AfricanSudaneseSwedishSwissSyrianTaiwaneseThaiTlingit-HaidaTohono O'OdhamTonganTrinidadian and TobagonianTsimshianTurkishU.S. Virgin IslanderUgandanUkrainianUruguayanUteVenezuelanVietnameseWelshWest IndianYakamaYaquiYugoslavianYumanYup'ikZimbabwean
Immigration
NonimmigrantsImmigrantsAfghanistanAfricaAlbaniaArgentinaArmeniaAsiaAustraliaAustriaBahamasBangladeshBarbadosBelarusBelgiumBelizeBoliviaBosnia and HerzegovinaBrazilBulgariaBurma/MyanmarCabo VerdeCambodiaCameroonCanadaCaribbeanCentral AmericaChileChinaColombiaCongoCosta RicaCroatiaCubaCzechoslovakiaDenmarkDominicaDominican RepublicEastern AfricaEastern AsiaEastern EuropeEcuadorEgyptEl SalvadorEnglandEritreaEthiopiaEuropeFijiFranceGermanyGhanaGreeceGrenadaGuatemalaGuyanaHaitiHondurasHong KongHungaryIndiaIndonesiaIranIraqIrelandIsraelItalyJamaicaJapanJordanKazakhstanKenyaKoreaKuwaitLaosLatin AmericaLatviaLebanonLiberiaLithuaniaMalaysiaMexicoMicronesiaMiddle AfricaMoldovaMoroccoNepalNetherlandsNicaraguaNigeriaNorth AmericaNorth MacedoniaNorthern AfricaNorthern EuropeNorwayOceaniaPakistanPanamaPeruPhilippinesPolandPortugalRomaniaRussiaSaudi ArabiaScotlandSenegalSerbiaSierra LeoneSingaporeSomaliaSouth AfricaSouth AmericaSouth Central AsiaSouth Eastern AsiaSouthern EuropeSpainSri LankaSt. Vincent and the GrenadinesSudanSwedenSwitzerlandSyriaTaiwanThailandTrinidad and TobagoTurkeyUgandaUkraineUruguayUzbekistanVenezuelaVietnamWest IndiesWestern AfricaWestern AsiaWestern EuropeYemenZaireZimbabweAzores
Select to Compare
Race
Ancestry
AfghanAfricanAlaska NativeAlaskan AthabascanAlbanianAleutAlsatianAmericanApacheArabArapahoArgentineanArmenianAssyrian/Chaldean/SyriacAustralianAustrianBahamianBangladeshiBarbadianBasqueBelgianBelizeanBermudanBhutaneseBlackfeetBolivianBrazilianBritishBritish West IndianBulgarianBurmeseCajunCambodianCanadianCape VerdeanCarpatho RusynCelticCentral AmericanCentral American IndianCherokeeCheyenneChickasawChileanChineseChippewaChoctawColombianColvilleComancheCreeCreekCroatianCrowCubanCypriotCzechCzechoslovakianDanishDelawareDominicanDutchDutch West IndianEastern EuropeanEcuadorianEgyptianEnglishEstonianEthiopianEuropeanFijianFilipinoFinnishFrenchFrench American IndianFrench CanadianGermanGerman RussianGhanaianGreekGuamanian/ChamorroGuatemalanGuyaneseHaitianHmongHonduranHopiHoumaHungarianIcelanderIndian (Asian)IndonesianInupiatIranianIraqiIrishIroquoisIsraeliItalianJamaicanJapaneseJordanianKenyanKiowaKoreanLaotianLatvianLebaneseLiberianLithuanianLumbeeLuxembourgerMacedonianMalaysianMalteseMarshalleseMenomineeMexicanMexican American IndianMongolianMoroccanNative HawaiianNavajoNepaleseNew ZealanderNicaraguanNigerianNorthern EuropeanNorwegianOkinawanOsageOttawaPaiutePakistaniPalestinianPanamanianParaguayanPennsylvania GermanPeruvianPimaPolishPortuguesePotawatomiPuebloPuerto RicanPuget Sound SalishRomanianRussianSalvadoranSamoanScandinavianScotch-IrishScottishSeminoleSenegaleseSerbianShoshoneSierra LeoneanSiouxSlavicSlovakSloveneSomaliSouth AfricanSouth AmericanSouth American IndianSoviet UnionSpaniardSpanishSpanish AmericanSpanish American IndianSri LankanSubsaharan AfricanSudaneseSwedishSwissSyrianTaiwaneseThaiTlingit-HaidaTohono O'OdhamTonganTrinidadian and TobagonianTsimshianTurkishU.S. Virgin IslanderUgandanUkrainianUruguayanUteVenezuelanVietnameseWelshWest IndianYakamaYaquiYugoslavianYumanYup'ikZimbabwean
Immigration
NonimmigrantsImmigrantsAfghanistanAfricaAlbaniaArgentinaArmeniaAsiaAustraliaAustriaBahamasBangladeshBarbadosBelarusBelgiumBelizeBoliviaBosnia and HerzegovinaBrazilBulgariaBurma/MyanmarCabo VerdeCambodiaCameroonCanadaCaribbeanCentral AmericaChileChinaColombiaCongoCosta RicaCroatiaCubaCzechoslovakiaDenmarkDominicaDominican RepublicEastern AfricaEastern AsiaEastern EuropeEcuadorEgyptEl SalvadorEnglandEritreaEthiopiaEuropeFijiFranceGermanyGhanaGreeceGrenadaGuatemalaGuyanaHaitiHondurasHong KongHungaryIndiaIndonesiaIranIraqIrelandIsraelItalyJamaicaJapanJordanKazakhstanKenyaKoreaKuwaitLaosLatin AmericaLatviaLebanonLiberiaLithuaniaMalaysiaMexicoMicronesiaMiddle AfricaMoldovaMoroccoNepalNetherlandsNicaraguaNigeriaNorth AmericaNorth MacedoniaNorthern AfricaNorthern EuropeNorwayOceaniaPakistanPanamaPeruPhilippinesPolandPortugalRomaniaRussiaSaudi ArabiaScotlandSenegalSerbiaSierra LeoneSingaporeSomaliaSouth AfricaSouth AmericaSouth Central AsiaSouth Eastern AsiaSouthern EuropeSpainSri LankaSt. Vincent and the GrenadinesSudanSwedenSwitzerlandSyriaTaiwanThailandTrinidad and TobagoTurkeyUgandaUkraineUruguayUzbekistanVenezuelaVietnamWest IndiesWestern AfricaWestern AsiaWestern EuropeYemenZaireZimbabweAzores
Wage/Income Gap
Income
Poverty
Unemployment
Labor Participation
Family Structure
Vehicle Availability
Education Level
Disability

Costa Rican Wage/Income Gap
Good

25.3%
WAGE/INCOME GAP
75.8/ 100
METRIC RATING
157th/ 347
METRIC RANK

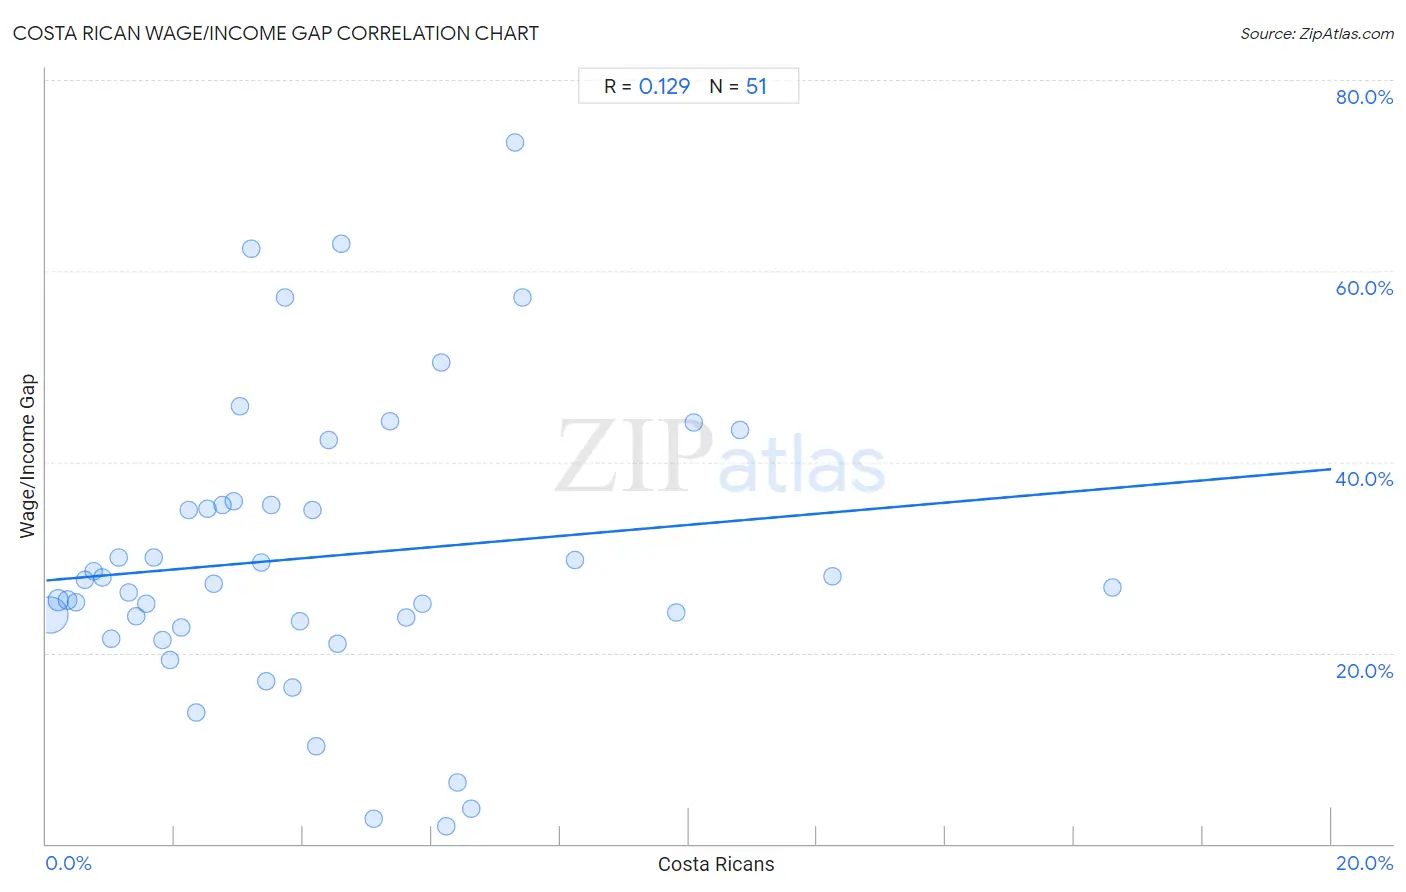
Costa Rican Wage/Income Gap Correlation Chart

The statistical analysis conducted on geographies consisting of 253,543,370 people shows a poor positive correlation between the proportion of Costa Ricans and wage/income gap percentage in the United States with a correlation coefficient (R) of 0.129 and weighted average of 25.3%. On average, for every 1% (one percent) increase in Costa Ricans within a typical geography, there is an increase of 0.58% in wage/income gap percentage.
Costa Rican Wage/Income Gap
It is essential to understand that the correlation between the percentage of Costa Ricans and wage/income gap percentage does not imply a direct cause-and-effect relationship. It remains uncertain whether the presence of Costa Ricans influences an upward or downward trend in the level of wage/income gap percentage within an area, or if Costa Ricans simply ended up residing in those areas with higher or lower levels of wage/income gap percentage due to other factors.

Demographics Similar to Costa Ricans by Wage/Income Gap

In terms of wage/income gap, the demographic groups most similar to Costa Ricans are Immigrants from Mexico (25.3%, a difference of 0.060%), Immigrants from Vietnam (25.2%, a difference of 0.18%), Immigrants from Zimbabwe (25.3%, a difference of 0.18%), Blackfeet (25.2%, a difference of 0.22%), and Immigrants from Northern Africa (25.2%, a difference of 0.22%).
DemographicsRating | RankWage/Income Gap
Immigrants
82.3
/100
|
#150
Excellent
25.1%
Taiwanese
81.6
/100
|
#151
Excellent
25.1%
Uruguayans
81.3
/100
|
#152
Excellent
25.2%
Blackfeet
78.1
/100
|
#153
Good
25.2%
Immigrants from Northern Africa
78.1
/100
|
#154
Good
25.2%
Immigrants from Vietnam
77.7
/100
|
#155
Good
25.2%
Immigrants from Mexico
76.4
/100
|
#156
Good
25.3%
Costa Ricans
75.8
/100
|
#157
Good
25.3%
Immigrants from Zimbabwe
73.7
/100
|
#158
Good
25.3%
Puget Sound Salish
73.0
/100
|
#159
Good
25.3%
French American Indians
72.5
/100
|
#160
Good
25.4%
Albanians
69.4
/100
|
#161
Good
25.4%
Shoshone
69.0
/100
|
#162
Good
25.4%
Native Hawaiians
69.0
/100
|
#163
Good
25.4%
Koreans
68.6
/100
|
#164
Good
25.4%

Costa Rican Wage/Income Gap Correlation Summary

MeasurementCosta Rican DataWage/Income Gap Data
Minimum0.054%1.8%
Maximum16.6%73.5%
Range16.5%71.7%
Mean4.2%30.0%
Median3.4%27.2%
Interquartile 25% (IQ1)1.7%22.7%
Interquartile 75% (IQ3)5.9%35.5%
Interquartile Range (IQR)4.2%12.9%
Standard Deviation (Sample)3.4%15.2%
Standard Deviation (Population)3.4%15.1%

Correlation Details

Costa Rican PercentileSample SizeWage/Income Gap
[
0.0%
-
0.5%
]
0.054%
193,637,83624.0%
[
0.0%
-
0.5%
]
0.19%
35,483,04025.6%
[
0.0%
-
0.5%
]
0.33%
11,351,55425.5%
[
0.0%
-
0.5%
]
0.46%
4,990,68425.3%
[
0.5%
-
1.0%
]
0.59%
2,813,19727.6%
[
0.5%
-
1.0%
]
0.73%
1,714,50728.6%
[
0.5%
-
1.0%
]
0.87%
890,52827.9%
[
1.0%
-
1.5%
]
1.00%
646,13521.4%
[
1.0%
-
1.5%
]
1.13%
351,26330.0%
[
1.0%
-
1.5%
]
1.28%
323,02826.3%
[
1.0%
-
1.5%
]
1.41%
215,58623.8%
[
1.5%
-
2.0%
]
1.55%
139,21925.2%
[
1.5%
-
2.0%
]
1.67%
146,06830.0%
[
1.5%
-
2.0%
]
1.81%
73,54721.3%
[
1.5%
-
2.0%
]
1.93%
200,66119.3%
[
2.0%
-
2.5%
]
2.10%
90,54822.7%
[
2.0%
-
2.5%
]
2.22%
38,09835.0%
[
2.0%
-
2.5%
]
2.33%
35,62513.8%
[
2.5%
-
3.0%
]
2.51%
11,16135.2%
[
2.5%
-
3.0%
]
2.60%
44,35427.2%
[
2.5%
-
3.0%
]
2.74%
30,43835.5%
[
2.5%
-
3.0%
]
2.91%
70,95135.8%
[
3.0%
-
3.5%
]
3.01%
40,32145.8%
[
3.0%
-
3.5%
]
3.19%
7,39762.4%
[
3.0%
-
3.5%
]
3.35%
24,17829.5%
[
3.0%
-
3.5%
]
3.42%
11,43517.1%
[
3.5%
-
4.0%
]
3.50%
62835.5%
[
3.5%
-
4.0%
]
3.71%
2,29257.2%
[
3.5%
-
4.0%
]
3.83%
21,50716.4%
[
3.5%
-
4.0%
]
3.96%
30,86623.3%
[
4.0%
-
4.5%
]
4.14%
8,73834.9%
[
4.0%
-
4.5%
]
4.20%
78610.1%
[
4.0%
-
4.5%
]
4.41%
9,78142.3%
[
4.5%
-
5.0%
]
4.52%
9,10520.9%
[
4.5%
-
5.0%
]
4.59%
50162.8%
[
5.0%
-
5.5%
]
5.10%
16,6022.6%
[
5.0%
-
5.5%
]
5.36%
61644.3%
[
5.5%
-
6.0%
]
5.60%
1,51923.7%
[
5.5%
-
6.0%
]
5.85%
8,28725.1%
[
6.0%
-
6.5%
]
6.15%
1,59450.4%
[
6.0%
-
6.5%
]
6.22%
5,3731.8%
[
6.0%
-
6.5%
]
6.39%
5,2266.4%
[
6.5%
-
7.0%
]
6.61%
9,6763.7%
[
7.0%
-
7.5%
]
7.29%
39873.5%
[
7.0%
-
7.5%
]
7.41%
29757.3%
[
8.0%
-
8.5%
]
8.23%
14,17329.7%
[
9.5%
-
10.0%
]
9.80%
11,90624.2%
[
10.0%
-
10.5%
]
10.07%
1,13244.1%
[
10.5%
-
11.0%
]
10.81%
65743.3%
[
12.0%
-
12.5%
]
12.24%
9828.0%
[
16.5%
-
17.0%
]
16.60%
25326.9%