Seminole vs Barbadian Wage/Income Gap
COMPARE
Seminole
Barbadian
Wage/Income Gap
Wage/Income Gap Comparison
Seminole
Barbadians
25.6%
WAGE/INCOME GAP
62.6/ 100
METRIC RATING
168th/ 347
METRIC RANK
19.0%
WAGE/INCOME GAP
100.0/ 100
METRIC RATING
9th/ 347
METRIC RANK
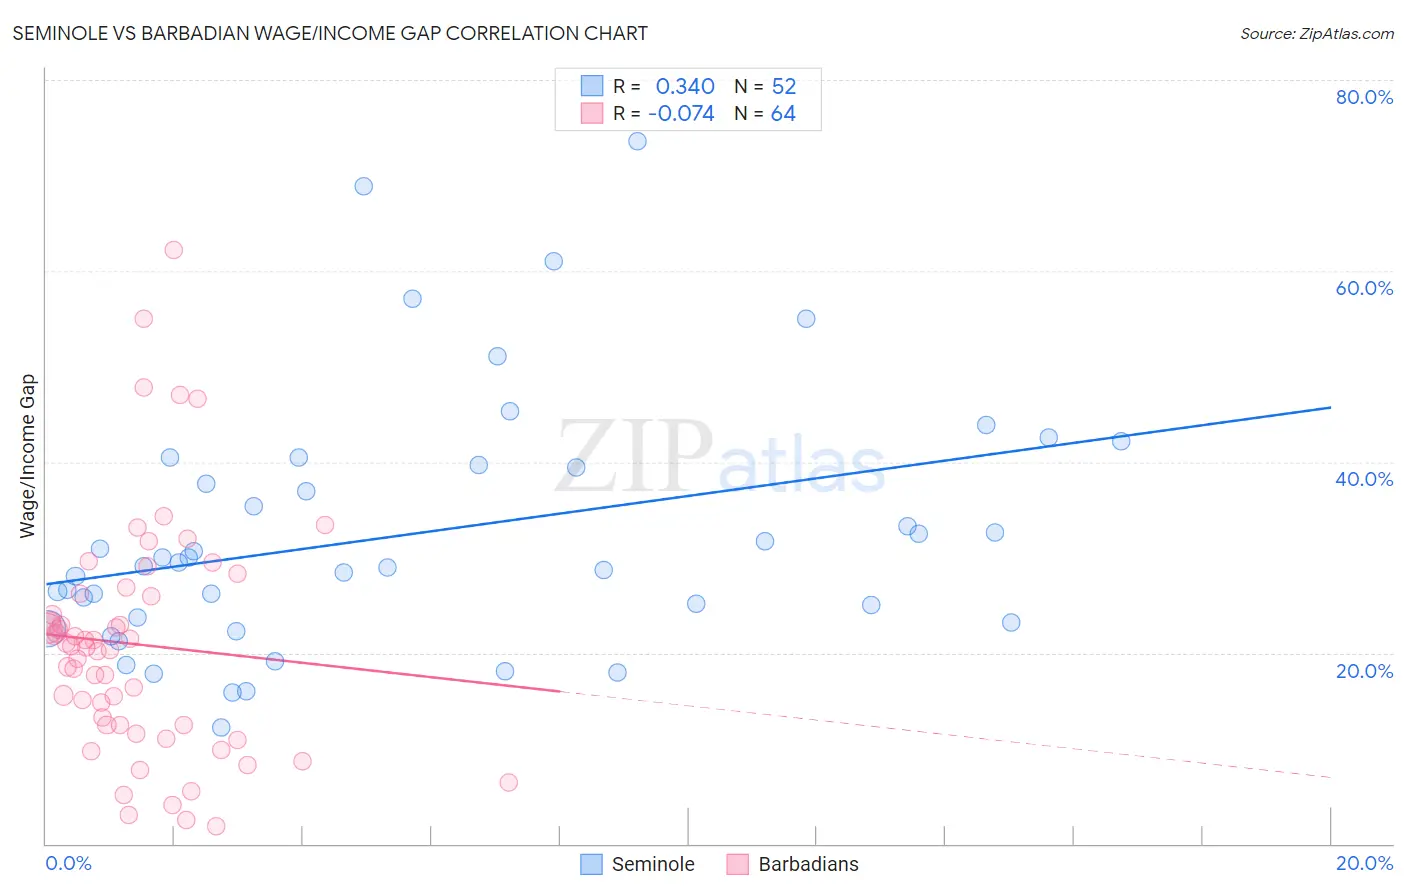
Seminole vs Barbadian Wage/Income Gap Correlation Chart
The statistical analysis conducted on geographies consisting of 118,242,273 people shows a mild positive correlation between the proportion of Seminole and wage/income gap percentage in the United States with a correlation coefficient (R) of 0.340 and weighted average of 25.6%. Similarly, the statistical analysis conducted on geographies consisting of 141,295,930 people shows a slight negative correlation between the proportion of Barbadians and wage/income gap percentage in the United States with a correlation coefficient (R) of -0.074 and weighted average of 19.0%, a difference of 34.8%.
Wage/Income Gap Correlation Summary
| Measurement | Seminole | Barbadian |
| Minimum | 12.2% | 1.8% |
| Maximum | 73.6% | 62.3% |
| Range | 61.3% | 60.4% |
| Mean | 32.4% | 20.9% |
| Median | 29.3% | 20.6% |
| Interquartile 25% (IQ1) | 23.5% | 12.4% |
| Interquartile 75% (IQ3) | 39.5% | 26.1% |
| Interquartile Range (IQR) | 16.1% | 13.7% |
| Standard Deviation (Sample) | 13.3% | 12.3% |
| Standard Deviation (Population) | 13.2% | 12.2% |
Similar Demographics by Wage/Income Gap
Demographics Similar to Seminole by Wage/Income Gap
In terms of wage/income gap, the demographic groups most similar to Seminole are Paiute (25.5%, a difference of 0.020%), Immigrants from Ukraine (25.5%, a difference of 0.080%), Immigrants from Hong Kong (25.5%, a difference of 0.090%), Peruvian (25.6%, a difference of 0.18%), and Immigrants from Oceania (25.6%, a difference of 0.35%).
| Demographics | Rating | Rank | Wage/Income Gap |
| Albanians | 69.4 /100 | #161 | Good 25.4% |
| Shoshone | 69.0 /100 | #162 | Good 25.4% |
| Native Hawaiians | 69.0 /100 | #163 | Good 25.4% |
| Koreans | 68.6 /100 | #164 | Good 25.4% |
| Immigrants | Hong Kong | 64.0 /100 | #165 | Good 25.5% |
| Immigrants | Ukraine | 63.8 /100 | #166 | Good 25.5% |
| Paiute | 62.9 /100 | #167 | Good 25.5% |
| Seminole | 62.6 /100 | #168 | Good 25.6% |
| Peruvians | 60.1 /100 | #169 | Good 25.6% |
| Immigrants | Oceania | 57.5 /100 | #170 | Average 25.6% |
| Immigrants | Greece | 56.6 /100 | #171 | Average 25.7% |
| Immigrants | Chile | 53.2 /100 | #172 | Average 25.7% |
| Immigrants | Belarus | 52.9 /100 | #173 | Average 25.7% |
| Alaskan Athabascans | 50.0 /100 | #174 | Average 25.8% |
| Sri Lankans | 47.0 /100 | #175 | Average 25.8% |
Demographics Similar to Barbadians by Wage/Income Gap
In terms of wage/income gap, the demographic groups most similar to Barbadians are Crow (19.1%, a difference of 0.53%), Immigrants from Jamaica (18.8%, a difference of 0.66%), Puerto Rican (18.7%, a difference of 1.3%), Immigrants from Haiti (19.2%, a difference of 1.3%), and Immigrants from West Indies (19.2%, a difference of 1.4%).
| Demographics | Rating | Rank | Wage/Income Gap |
| Immigrants | St. Vincent and the Grenadines | 100.0 /100 | #2 | Exceptional 16.4% |
| Immigrants | Barbados | 100.0 /100 | #3 | Exceptional 17.8% |
| British West Indians | 100.0 /100 | #4 | Exceptional 18.0% |
| Guyanese | 100.0 /100 | #5 | Exceptional 18.3% |
| Immigrants | Guyana | 100.0 /100 | #6 | Exceptional 18.4% |
| Puerto Ricans | 100.0 /100 | #7 | Exceptional 18.7% |
| Immigrants | Jamaica | 100.0 /100 | #8 | Exceptional 18.8% |
| Barbadians | 100.0 /100 | #9 | Exceptional 19.0% |
| Crow | 100.0 /100 | #10 | Exceptional 19.1% |
| Immigrants | Haiti | 100.0 /100 | #11 | Exceptional 19.2% |
| Immigrants | West Indies | 100.0 /100 | #12 | Exceptional 19.2% |
| Trinidadians and Tobagonians | 100.0 /100 | #13 | Exceptional 19.3% |
| Immigrants | Trinidad and Tobago | 100.0 /100 | #14 | Exceptional 19.3% |
| West Indians | 100.0 /100 | #15 | Exceptional 19.6% |
| Jamaicans | 100.0 /100 | #16 | Exceptional 19.6% |