Colville Wage/Income Gap
COMPARE
Colville
Select to Compare
Wage/Income Gap
Colville Wage/Income Gap
21.3%
WAGE/INCOME GAP
100.0/ 100
METRIC RATING
39th/ 347
METRIC RANK
Colville Wage/Income Gap Correlation Chart
The statistical analysis conducted on geographies consisting of 34,676,547 people shows a poor negative correlation between the proportion of Colville and wage/income gap percentage in the United States with a correlation coefficient (R) of -0.154 and weighted average of 21.3%. On average, for every 1% (one percent) increase in Colville within a typical geography, there is a decrease of 0.12% in wage/income gap percentage.
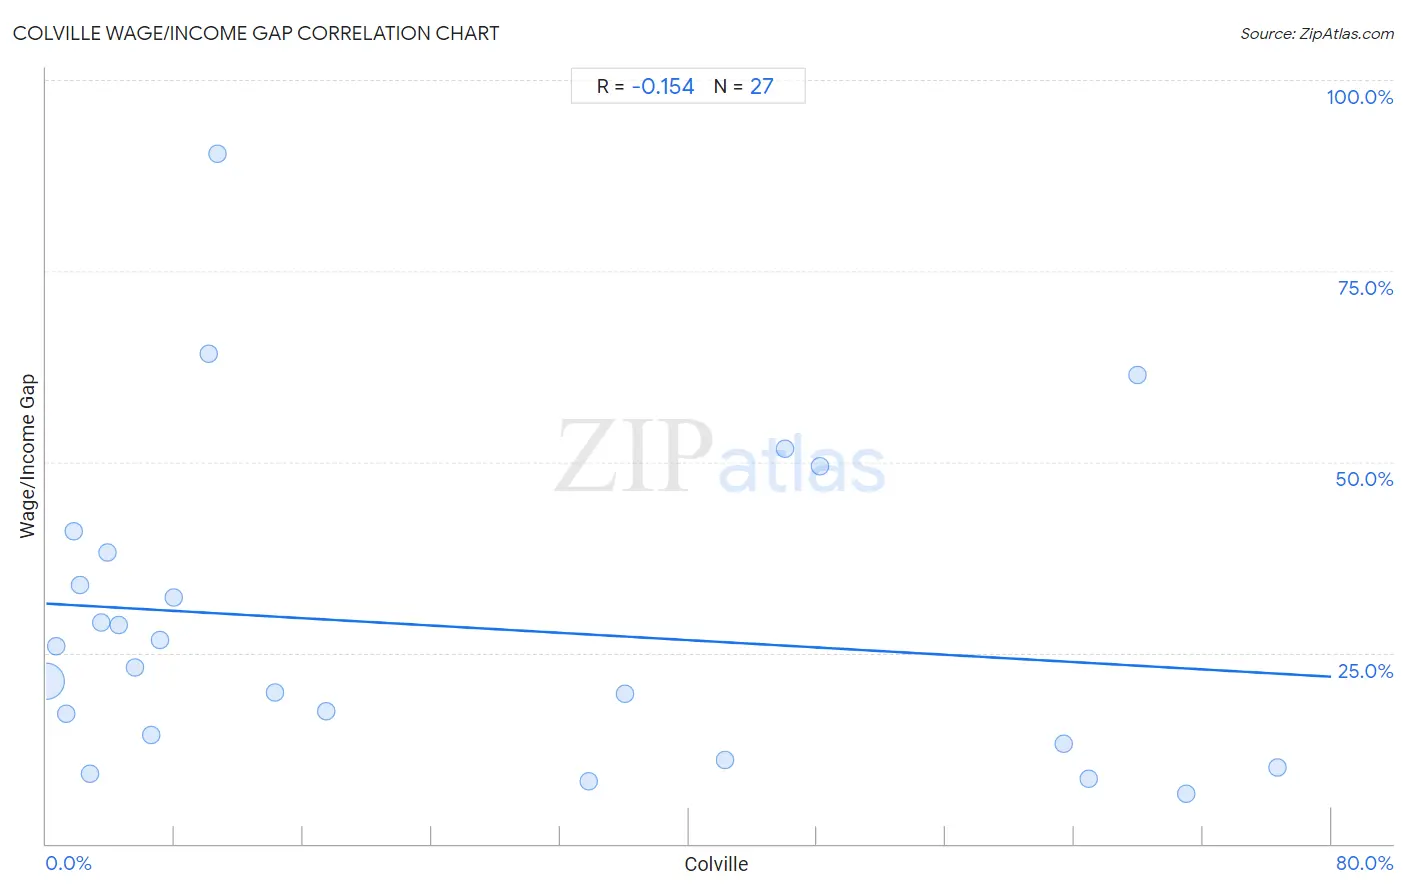
It is essential to understand that the correlation between the percentage of Colville and wage/income gap percentage does not imply a direct cause-and-effect relationship. It remains uncertain whether the presence of Colville influences an upward or downward trend in the level of wage/income gap percentage within an area, or if Colville simply ended up residing in those areas with higher or lower levels of wage/income gap percentage due to other factors.
Demographics Similar to Colville by Wage/Income Gap
In terms of wage/income gap, the demographic groups most similar to Colville are Immigrants from Belize (21.3%, a difference of 0.11%), Immigrants from Somalia (21.2%, a difference of 0.16%), Lumbee (21.3%, a difference of 0.20%), Belizean (21.2%, a difference of 0.23%), and Somali (21.2%, a difference of 0.25%).
| Demographics | Rating | Rank | Wage/Income Gap |
| Immigrants from Yemen | 100.0 /100 | #32 | Exceptional 21.1% |
| Immigrants from Bahamas | 100.0 /100 | #33 | Exceptional 21.1% |
| Pima | 100.0 /100 | #34 | Exceptional 21.1% |
| Somalis | 100.0 /100 | #35 | Exceptional 21.2% |
| Belizeans | 100.0 /100 | #36 | Exceptional 21.2% |
| Immigrants from Somalia | 100.0 /100 | #37 | Exceptional 21.2% |
| Immigrants from Belize | 100.0 /100 | #38 | Exceptional 21.3% |
| Colville | 100.0 /100 | #39 | Exceptional 21.3% |
| Lumbee | 100.0 /100 | #40 | Exceptional 21.3% |
| Liberians | 100.0 /100 | #41 | Exceptional 21.4% |
| Immigrants from Sierra Leone | 100.0 /100 | #42 | Exceptional 21.4% |
| Sierra Leoneans | 100.0 /100 | #43 | Exceptional 21.4% |
| Immigrants from Eritrea | 100.0 /100 | #44 | Exceptional 21.4% |
| U.S. Virgin Islanders | 100.0 /100 | #45 | Exceptional 21.5% |
| Immigrants from Ethiopia | 100.0 /100 | #46 | Exceptional 21.6% |
Colville Wage/Income Gap Correlation Summary
| Measurement | Colville Data | Wage/Income Gap Data |
| Minimum | 0.026% | 6.6% |
| Maximum | 76.7% | 90.4% |
| Range | 76.6% | 83.8% |
| Mean | 24.1% | 28.6% |
| Median | 10.2% | 23.1% |
| Interquartile 25% (IQ1) | 3.4% | 13.1% |
| Interquartile 75% (IQ3) | 46.0% | 38.1% |
| Interquartile Range (IQR) | 42.6% | 25.0% |
| Standard Deviation (Sample) | 26.1% | 20.3% |
| Standard Deviation (Population) | 25.6% | 19.9% |
Correlation Details
| Colville Percentile | Sample Size | Wage/Income Gap |
[ 0.0% - 0.5% ] 0.026% | 34,434,974 | 21.2% |
[ 0.5% - 1.0% ] 0.64% | 130,117 | 25.8% |
[ 1.0% - 1.5% ] 1.28% | 35,480 | 17.1% |
[ 1.5% - 2.0% ] 1.70% | 13,619 | 40.9% |
[ 2.0% - 2.5% ] 2.11% | 17,953 | 33.9% |
[ 2.5% - 3.0% ] 2.75% | 4,915 | 9.1% |
[ 3.0% - 3.5% ] 3.39% | 4,802 | 29.0% |
[ 3.5% - 4.0% ] 3.83% | 4,957 | 38.1% |
[ 4.5% - 5.0% ] 4.53% | 5,033 | 28.7% |
[ 5.5% - 6.0% ] 5.53% | 561 | 23.1% |
[ 6.5% - 7.0% ] 6.54% | 5,241 | 14.2% |
[ 7.0% - 7.5% ] 7.09% | 127 | 26.7% |
[ 7.5% - 8.0% ] 7.92% | 1,098 | 32.3% |
[ 10.0% - 10.5% ] 10.15% | 1,034 | 64.2% |
[ 10.5% - 11.0% ] 10.66% | 122 | 90.4% |
[ 14.0% - 14.5% ] 14.22% | 9,218 | 19.9% |
[ 17.0% - 17.5% ] 17.45% | 424 | 17.3% |
[ 33.5% - 34.0% ] 33.81% | 1,538 | 8.3% |
[ 36.0% - 36.5% ] 36.06% | 1,334 | 19.6% |
[ 42.0% - 42.5% ] 42.28% | 395 | 10.9% |
[ 46.0% - 46.5% ] 46.01% | 276 | 51.8% |
[ 48.0% - 48.5% ] 48.15% | 270 | 49.5% |
[ 63.0% - 63.5% ] 63.38% | 568 | 13.1% |
[ 64.5% - 65.0% ] 64.91% | 1,103 | 8.4% |
[ 67.5% - 68.0% ] 67.97% | 256 | 61.4% |
[ 70.5% - 71.0% ] 70.97% | 155 | 6.6% |
[ 76.5% - 77.0% ] 76.66% | 977 | 10.0% |