Immigrants from Ethiopia Wage/Income Gap

COMPARE

Immigrants from Ethiopia
Race
Ancestry
AfghanAfricanAlaska NativeAlaskan AthabascanAlbanianAleutAlsatianAmericanApacheArabArapahoArgentineanArmenianAssyrian/Chaldean/SyriacAustralianAustrianBahamianBangladeshiBarbadianBasqueBelgianBelizeanBermudanBhutaneseBlackfeetBolivianBrazilianBritishBritish West IndianBulgarianBurmeseCajunCambodianCanadianCape VerdeanCarpatho RusynCelticCentral AmericanCentral American IndianCherokeeCheyenneChickasawChileanChineseChippewaChoctawColombianColvilleComancheCosta RicanCreeCreekCroatianCrowCubanCypriotCzechCzechoslovakianDanishDelawareDominicanDutchDutch West IndianEastern EuropeanEcuadorianEgyptianEnglishEstonianEthiopianEuropeanFijianFilipinoFinnishFrenchFrench American IndianFrench CanadianGermanGerman RussianGhanaianGreekGuamanian/ChamorroGuatemalanGuyaneseHaitianHmongHonduranHopiHoumaHungarianIcelanderIndian (Asian)IndonesianInupiatIranianIraqiIrishIroquoisIsraeliItalianJamaicanJapaneseJordanianKenyanKiowaKoreanLaotianLatvianLebaneseLiberianLithuanianLumbeeLuxembourgerMacedonianMalaysianMalteseMarshalleseMenomineeMexicanMexican American IndianMongolianMoroccanNative HawaiianNavajoNepaleseNew ZealanderNicaraguanNigerianNorthern EuropeanNorwegianOkinawanOsageOttawaPaiutePakistaniPalestinianPanamanianParaguayanPennsylvania GermanPeruvianPimaPolishPortuguesePotawatomiPuebloPuerto RicanPuget Sound SalishRomanianRussianSalvadoranSamoanScandinavianScotch-IrishScottishSeminoleSenegaleseSerbianShoshoneSierra LeoneanSiouxSlavicSlovakSloveneSomaliSouth AfricanSouth AmericanSouth American IndianSoviet UnionSpaniardSpanishSpanish AmericanSpanish American IndianSri LankanSubsaharan AfricanSudaneseSwedishSwissSyrianTaiwaneseThaiTlingit-HaidaTohono O'OdhamTonganTrinidadian and TobagonianTsimshianTurkishU.S. Virgin IslanderUgandanUkrainianUruguayanUteVenezuelanVietnameseWelshWest IndianYakamaYaquiYugoslavianYumanYup'ikZimbabwean
Immigration
NonimmigrantsImmigrantsAfghanistanAfricaAlbaniaArgentinaArmeniaAsiaAustraliaAustriaBahamasBangladeshBarbadosBelarusBelgiumBelizeBoliviaBosnia and HerzegovinaBrazilBulgariaBurma/MyanmarCabo VerdeCambodiaCameroonCanadaCaribbeanCentral AmericaChileChinaColombiaCongoCosta RicaCroatiaCubaCzechoslovakiaDenmarkDominicaDominican RepublicEastern AfricaEastern AsiaEastern EuropeEcuadorEgyptEl SalvadorEnglandEritreaEthiopiaEuropeFijiFranceGermanyGhanaGreeceGrenadaGuatemalaGuyanaHaitiHondurasHong KongHungaryIndiaIndonesiaIranIraqIrelandIsraelItalyJamaicaJapanJordanKazakhstanKenyaKoreaKuwaitLaosLatin AmericaLatviaLebanonLiberiaLithuaniaMalaysiaMexicoMicronesiaMiddle AfricaMoldovaMoroccoNepalNetherlandsNicaraguaNigeriaNorth AmericaNorth MacedoniaNorthern AfricaNorthern EuropeNorwayOceaniaPakistanPanamaPeruPhilippinesPolandPortugalRomaniaRussiaSaudi ArabiaScotlandSenegalSerbiaSierra LeoneSingaporeSomaliaSouth AfricaSouth AmericaSouth Central AsiaSouth Eastern AsiaSouthern EuropeSpainSri LankaSt. Vincent and the GrenadinesSudanSwedenSwitzerlandSyriaTaiwanThailandTrinidad and TobagoTurkeyUgandaUkraineUruguayUzbekistanVenezuelaVietnamWest IndiesWestern AfricaWestern AsiaWestern EuropeYemenZaireZimbabweAzores
Select to Compare
Race
Ancestry
AfghanAfricanAlaska NativeAlaskan AthabascanAlbanianAleutAlsatianAmericanApacheArabArapahoArgentineanArmenianAssyrian/Chaldean/SyriacAustralianAustrianBahamianBangladeshiBarbadianBasqueBelgianBelizeanBermudanBhutaneseBlackfeetBolivianBrazilianBritishBritish West IndianBulgarianBurmeseCajunCambodianCanadianCape VerdeanCarpatho RusynCelticCentral AmericanCentral American IndianCherokeeCheyenneChickasawChileanChineseChippewaChoctawColombianColvilleComancheCosta RicanCreeCreekCroatianCrowCubanCypriotCzechCzechoslovakianDanishDelawareDominicanDutchDutch West IndianEastern EuropeanEcuadorianEgyptianEnglishEstonianEthiopianEuropeanFijianFilipinoFinnishFrenchFrench American IndianFrench CanadianGermanGerman RussianGhanaianGreekGuamanian/ChamorroGuatemalanGuyaneseHaitianHmongHonduranHopiHoumaHungarianIcelanderIndian (Asian)IndonesianInupiatIranianIraqiIrishIroquoisIsraeliItalianJamaicanJapaneseJordanianKenyanKiowaKoreanLaotianLatvianLebaneseLiberianLithuanianLumbeeLuxembourgerMacedonianMalaysianMalteseMarshalleseMenomineeMexicanMexican American IndianMongolianMoroccanNative HawaiianNavajoNepaleseNew ZealanderNicaraguanNigerianNorthern EuropeanNorwegianOkinawanOsageOttawaPaiutePakistaniPalestinianPanamanianParaguayanPennsylvania GermanPeruvianPimaPolishPortuguesePotawatomiPuebloPuerto RicanPuget Sound SalishRomanianRussianSalvadoranSamoanScandinavianScotch-IrishScottishSeminoleSenegaleseSerbianShoshoneSierra LeoneanSiouxSlavicSlovakSloveneSomaliSouth AfricanSouth AmericanSouth American IndianSoviet UnionSpaniardSpanishSpanish AmericanSpanish American IndianSri LankanSubsaharan AfricanSudaneseSwedishSwissSyrianTaiwaneseThaiTlingit-HaidaTohono O'OdhamTonganTrinidadian and TobagonianTsimshianTurkishU.S. Virgin IslanderUgandanUkrainianUruguayanUteVenezuelanVietnameseWelshWest IndianYakamaYaquiYugoslavianYumanYup'ikZimbabwean
Immigration
NonimmigrantsImmigrantsAfghanistanAfricaAlbaniaArgentinaArmeniaAsiaAustraliaAustriaBahamasBangladeshBarbadosBelarusBelgiumBelizeBoliviaBosnia and HerzegovinaBrazilBulgariaBurma/MyanmarCabo VerdeCambodiaCameroonCanadaCaribbeanCentral AmericaChileChinaColombiaCongoCosta RicaCroatiaCubaCzechoslovakiaDenmarkDominicaDominican RepublicEastern AfricaEastern AsiaEastern EuropeEcuadorEgyptEl SalvadorEnglandEritreaEuropeFijiFranceGermanyGhanaGreeceGrenadaGuatemalaGuyanaHaitiHondurasHong KongHungaryIndiaIndonesiaIranIraqIrelandIsraelItalyJamaicaJapanJordanKazakhstanKenyaKoreaKuwaitLaosLatin AmericaLatviaLebanonLiberiaLithuaniaMalaysiaMexicoMicronesiaMiddle AfricaMoldovaMoroccoNepalNetherlandsNicaraguaNigeriaNorth AmericaNorth MacedoniaNorthern AfricaNorthern EuropeNorwayOceaniaPakistanPanamaPeruPhilippinesPolandPortugalRomaniaRussiaSaudi ArabiaScotlandSenegalSerbiaSierra LeoneSingaporeSomaliaSouth AfricaSouth AmericaSouth Central AsiaSouth Eastern AsiaSouthern EuropeSpainSri LankaSt. Vincent and the GrenadinesSudanSwedenSwitzerlandSyriaTaiwanThailandTrinidad and TobagoTurkeyUgandaUkraineUruguayUzbekistanVenezuelaVietnamWest IndiesWestern AfricaWestern AsiaWestern EuropeYemenZaireZimbabweAzores
Wage/Income Gap
Income
Poverty
Unemployment
Labor Participation
Family Structure
Vehicle Availability
Education Level
Disability

Immigrants from Ethiopia Wage/Income Gap
Exceptional

21.6%
WAGE/INCOME GAP
100.0/ 100
METRIC RATING
46th/ 347
METRIC RANK

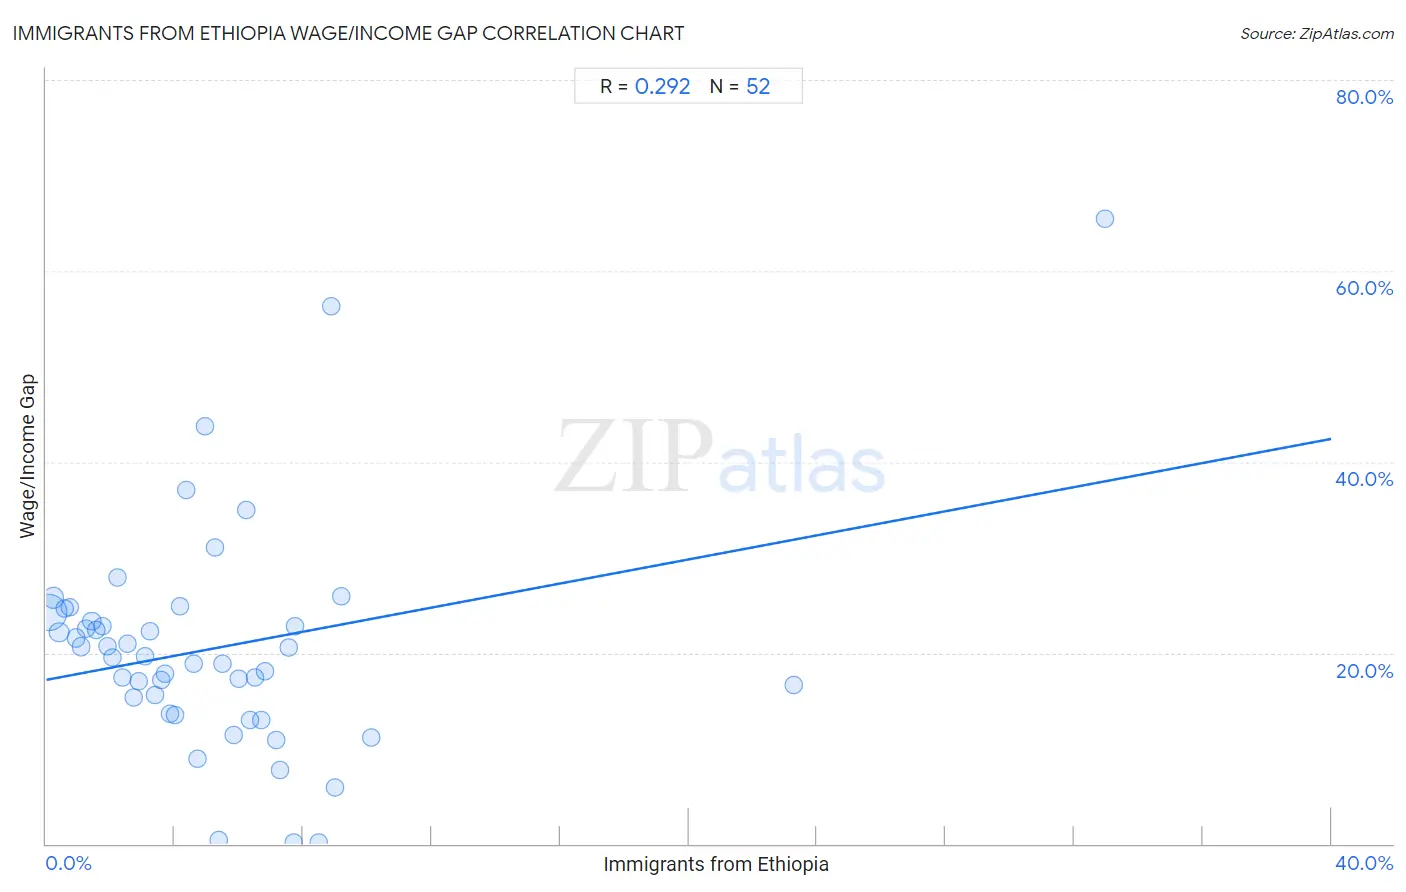
Immigrants from Ethiopia Wage/Income Gap Correlation Chart

The statistical analysis conducted on geographies consisting of 211,530,252 people shows a weak positive correlation between the proportion of Immigrants from Ethiopia and wage/income gap percentage in the United States with a correlation coefficient (R) of 0.292 and weighted average of 21.6%. On average, for every 1% (one percent) increase in Immigrants from Ethiopia within a typical geography, there is an increase of 0.63% in wage/income gap percentage.
Immigrants from Ethiopia Wage/Income Gap
It is essential to understand that the correlation between the percentage of Immigrants from Ethiopia and wage/income gap percentage does not imply a direct cause-and-effect relationship. It remains uncertain whether the presence of Immigrants from Ethiopia influences an upward or downward trend in the level of wage/income gap percentage within an area, or if Immigrants from Ethiopia simply ended up residing in those areas with higher or lower levels of wage/income gap percentage due to other factors.

Demographics Similar to Immigrants from Ethiopia by Wage/Income Gap

In terms of wage/income gap, the demographic groups most similar to Immigrants from Ethiopia are U.S. Virgin Islander (21.5%, a difference of 0.12%), Immigrants from Congo (21.7%, a difference of 0.55%), Immigrants from Eritrea (21.4%, a difference of 0.56%), Sierra Leonean (21.4%, a difference of 0.58%), and Liberian (21.4%, a difference of 0.64%).
DemographicsRating | RankWage/Income Gap
Colville
100.0
/100
|
#39
Exceptional
21.3%
Lumbee
100.0
/100
|
#40
Exceptional
21.3%
Liberians
100.0
/100
|
#41
Exceptional
21.4%
Immigrants from Sierra Leone
100.0
/100
|
#42
Exceptional
21.4%
Sierra Leoneans
100.0
/100
|
#43
Exceptional
21.4%
Immigrants from Eritrea
100.0
/100
|
#44
Exceptional
21.4%
U.S. Virgin Islanders
100.0
/100
|
#45
Exceptional
21.5%
Immigrants from Ethiopia
100.0
/100
|
#46
Exceptional
21.6%
Immigrants from Congo
100.0
/100
|
#47
Exceptional
21.7%
Blacks/African Americans
100.0
/100
|
#48
Exceptional
21.7%
Ethiopians
100.0
/100
|
#49
Exceptional
21.8%
Immigrants from Western Africa
100.0
/100
|
#50
Exceptional
22.0%
Tohono O'odham
100.0
/100
|
#51
Exceptional
22.1%
Immigrants from Cameroon
100.0
/100
|
#52
Exceptional
22.2%
Bangladeshis
100.0
/100
|
#53
Exceptional
22.2%

Immigrants from Ethiopia Wage/Income Gap Correlation Summary

MeasurementImmigrants from Ethiopia DataWage/Income Gap Data
Minimum0.061%0.11%
Maximum33.0%65.4%
Range32.9%65.3%
Mean5.3%20.5%
Median4.3%19.5%
Interquartile 25% (IQ1)2.2%14.5%
Interquartile 75% (IQ3)6.8%23.8%
Interquartile Range (IQR)4.6%9.4%
Standard Deviation (Sample)5.4%11.7%
Standard Deviation (Population)5.4%11.6%

Correlation Details

Immigrants from Ethiopia PercentileSample SizeWage/Income Gap
[
0.0%
-
0.5%
]
0.061%
150,643,72224.3%
[
0.0%
-
0.5%
]
0.23%
25,231,88925.8%
[
0.0%
-
0.5%
]
0.41%
13,374,80022.1%
[
0.5%
-
1.0%
]
0.57%
4,759,30924.6%
[
0.5%
-
1.0%
]
0.73%
3,454,31424.8%
[
0.5%
-
1.0%
]
0.92%
2,595,27621.5%
[
1.0%
-
1.5%
]
1.08%
2,697,09420.6%
[
1.0%
-
1.5%
]
1.23%
1,601,58622.5%
[
1.0%
-
1.5%
]
1.42%
1,248,66323.4%
[
1.5%
-
2.0%
]
1.56%
988,71222.5%
[
1.5%
-
2.0%
]
1.73%
716,56222.8%
[
1.5%
-
2.0%
]
1.91%
440,30220.7%
[
2.0%
-
2.5%
]
2.07%
336,75819.5%
[
2.0%
-
2.5%
]
2.23%
196,42827.9%
[
2.0%
-
2.5%
]
2.38%
224,27617.4%
[
2.5%
-
3.0%
]
2.55%
255,76620.9%
[
2.5%
-
3.0%
]
2.72%
405,74015.3%
[
2.5%
-
3.0%
]
2.88%
294,91817.1%
[
3.0%
-
3.5%
]
3.06%
219,63219.6%
[
3.0%
-
3.5%
]
3.23%
165,05422.3%
[
3.0%
-
3.5%
]
3.40%
110,22915.5%
[
3.5%
-
4.0%
]
3.59%
62,72317.1%
[
3.5%
-
4.0%
]
3.71%
163,78317.8%
[
3.5%
-
4.0%
]
3.86%
263,07613.6%
[
4.0%
-
4.5%
]
4.00%
86,66213.5%
[
4.0%
-
4.5%
]
4.17%
34,96724.9%
[
4.0%
-
4.5%
]
4.37%
4,16137.1%
[
4.5%
-
5.0%
]
4.60%
73,07418.8%
[
4.5%
-
5.0%
]
4.70%
75,8068.9%
[
4.5%
-
5.0%
]
4.95%
4,02343.7%
[
5.0%
-
5.5%
]
5.26%
25,32431.0%
[
5.0%
-
5.5%
]
5.37%
29,1320.35%
[
5.0%
-
5.5%
]
5.48%
11,71618.8%
[
5.5%
-
6.0%
]
5.85%
97,66111.4%
[
5.5%
-
6.0%
]
5.99%
152,98417.3%
[
6.0%
-
6.5%
]
6.24%
4,76334.9%
[
6.0%
-
6.5%
]
6.35%
56,73713.0%
[
6.5%
-
7.0%
]
6.51%
81,80817.4%
[
6.5%
-
7.0%
]
6.69%
73,29212.9%
[
6.5%
-
7.0%
]
6.82%
23,50518.0%
[
7.0%
-
7.5%
]
7.14%
75,53410.9%
[
7.0%
-
7.5%
]
7.28%
30,9277.7%
[
7.5%
-
8.0%
]
7.54%
17,54220.5%
[
7.5%
-
8.0%
]
7.71%
27,5230.17%
[
7.5%
-
8.0%
]
7.75%
37,20722.7%
[
8.0%
-
8.5%
]
8.50%
18,3240.11%
[
8.5%
-
9.0%
]
8.86%
58756.4%
[
8.5%
-
9.0%
]
8.97%
5355.9%
[
9.0%
-
9.5%
]
9.17%
15,48925.9%
[
10.0%
-
10.5%
]
10.11%
15,60311.2%
[
23.0%
-
23.5%
]
23.25%
4,57216.7%
[
32.5%
-
33.0%
]
32.97%
18265.4%