Central American Wage/Income Gap
COMPARE
Central American
Select to Compare
Wage/Income Gap
Central American Wage/Income Gap
23.1%
WAGE/INCOME GAP
99.8/ 100
METRIC RATING
82nd/ 347
METRIC RANK
Central American Wage/Income Gap Correlation Chart
The statistical analysis conducted on geographies consisting of 503,863,449 people shows a poor positive correlation between the proportion of Central Americans and wage/income gap percentage in the United States with a correlation coefficient (R) of 0.111 and weighted average of 23.1%. On average, for every 1% (one percent) increase in Central Americans within a typical geography, there is an increase of 0.050% in wage/income gap percentage.
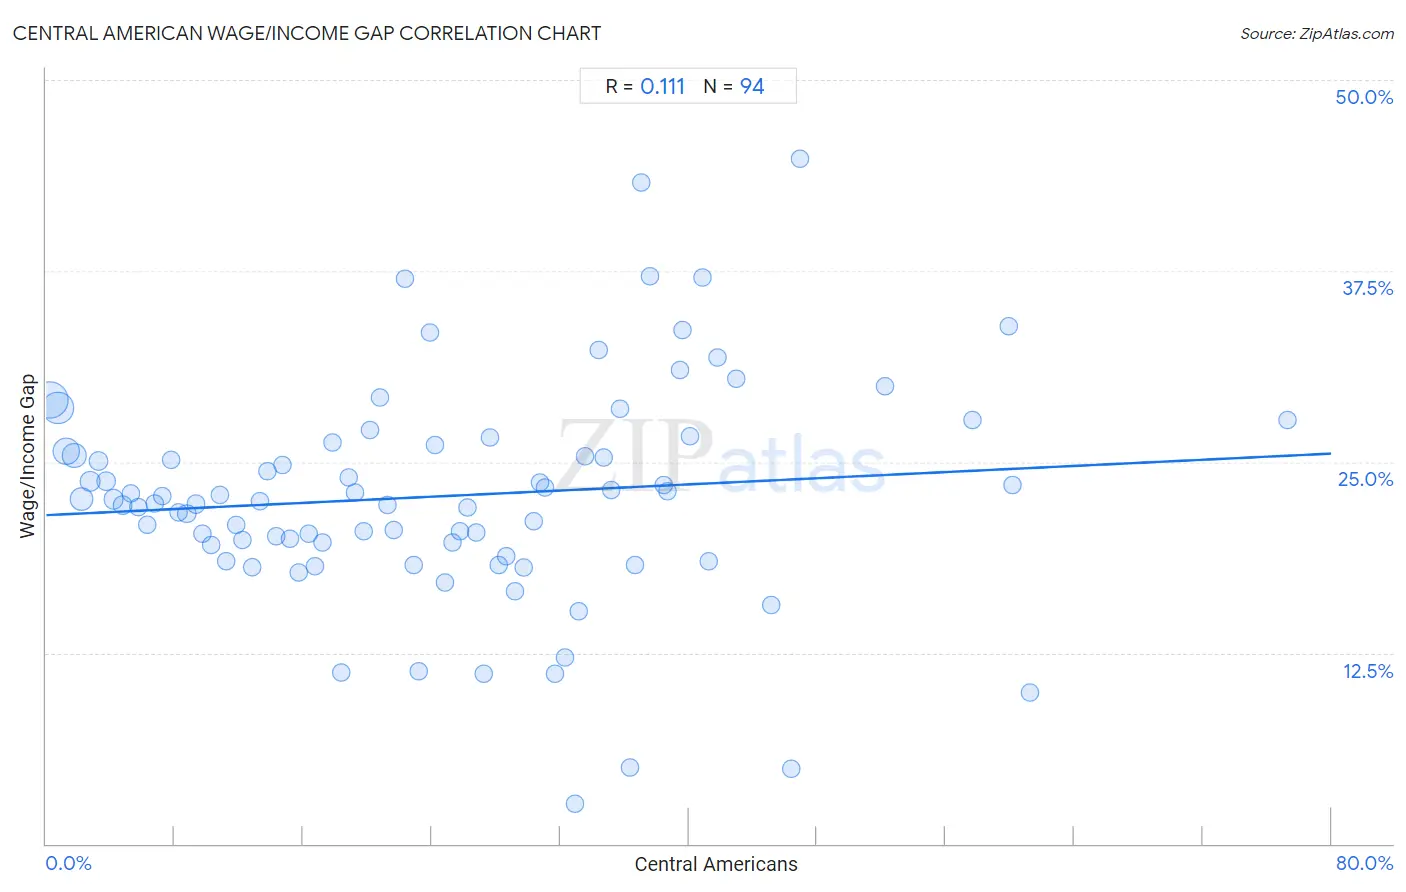
It is essential to understand that the correlation between the percentage of Central Americans and wage/income gap percentage does not imply a direct cause-and-effect relationship. It remains uncertain whether the presence of Central Americans influences an upward or downward trend in the level of wage/income gap percentage within an area, or if Central Americans simply ended up residing in those areas with higher or lower levels of wage/income gap percentage due to other factors.
Demographics Similar to Central Americans by Wage/Income Gap
In terms of wage/income gap, the demographic groups most similar to Central Americans are Bermudan (23.1%, a difference of 0.0%), Immigrants from Africa (23.2%, a difference of 0.29%), Salvadoran (23.0%, a difference of 0.47%), Immigrants from Nicaragua (23.0%, a difference of 0.54%), and Nigerian (23.0%, a difference of 0.62%).
| Demographics | Rating | Rank | Wage/Income Gap |
| Fijians | 99.9 /100 | #75 | Exceptional 22.9% |
| Ecuadorians | 99.9 /100 | #76 | Exceptional 22.9% |
| Africans | 99.9 /100 | #77 | Exceptional 22.9% |
| Nigerians | 99.9 /100 | #78 | Exceptional 23.0% |
| Immigrants from Nicaragua | 99.9 /100 | #79 | Exceptional 23.0% |
| Salvadorans | 99.9 /100 | #80 | Exceptional 23.0% |
| Bermudans | 99.8 /100 | #81 | Exceptional 23.1% |
| Central Americans | 99.8 /100 | #82 | Exceptional 23.1% |
| Immigrants from Africa | 99.8 /100 | #83 | Exceptional 23.2% |
| Cubans | 99.7 /100 | #84 | Exceptional 23.3% |
| Immigrants from Cambodia | 99.7 /100 | #85 | Exceptional 23.3% |
| Cheyenne | 99.7 /100 | #86 | Exceptional 23.3% |
| Yuman | 99.7 /100 | #87 | Exceptional 23.3% |
| Immigrants from Panama | 99.6 /100 | #88 | Exceptional 23.4% |
| Marshallese | 99.6 /100 | #89 | Exceptional 23.4% |
Central American Wage/Income Gap Correlation Summary
| Measurement | Central American Data | Wage/Income Gap Data |
| Minimum | 0.24% | 2.7% |
| Maximum | 77.3% | 44.8% |
| Range | 77.1% | 42.2% |
| Mean | 24.6% | 22.7% |
| Median | 23.5% | 22.5% |
| Interquartile 25% (IQ1) | 11.8% | 19.5% |
| Interquartile 75% (IQ3) | 35.2% | 26.1% |
| Interquartile Range (IQR) | 23.4% | 6.6% |
| Standard Deviation (Sample) | 15.9% | 7.2% |
| Standard Deviation (Population) | 15.9% | 7.2% |
Correlation Details
| Central American Percentile | Sample Size | Wage/Income Gap |
[ 0.0% - 0.5% ] 0.24% | 145,524,178 | 29.0% |
[ 0.5% - 1.0% ] 0.73% | 100,038,845 | 28.5% |
[ 1.0% - 1.5% ] 1.24% | 67,716,882 | 25.7% |
[ 1.5% - 2.0% ] 1.74% | 40,955,791 | 25.4% |
[ 2.0% - 2.5% ] 2.21% | 34,528,634 | 22.6% |
[ 2.5% - 3.0% ] 2.75% | 18,018,252 | 23.8% |
[ 3.0% - 3.5% ] 3.25% | 13,483,266 | 25.0% |
[ 3.5% - 4.0% ] 3.74% | 10,897,245 | 23.7% |
[ 4.0% - 4.5% ] 4.20% | 11,915,798 | 22.6% |
[ 4.5% - 5.0% ] 4.77% | 7,842,447 | 22.2% |
[ 5.0% - 5.5% ] 5.26% | 5,372,942 | 22.9% |
[ 5.5% - 6.0% ] 5.74% | 5,803,067 | 22.0% |
[ 6.0% - 6.5% ] 6.27% | 3,663,930 | 20.9% |
[ 6.5% - 7.0% ] 6.76% | 3,872,119 | 22.3% |
[ 7.0% - 7.5% ] 7.25% | 2,747,951 | 22.8% |
[ 7.5% - 8.0% ] 7.76% | 1,918,554 | 25.1% |
[ 8.0% - 8.5% ] 8.21% | 2,105,204 | 21.7% |
[ 8.5% - 9.0% ] 8.74% | 1,799,417 | 21.6% |
[ 9.0% - 9.5% ] 9.33% | 3,980,119 | 22.2% |
[ 9.5% - 10.0% ] 9.73% | 1,157,702 | 20.3% |
[ 10.0% - 10.5% ] 10.29% | 939,051 | 19.5% |
[ 10.5% - 11.0% ] 10.78% | 1,217,514 | 22.9% |
[ 11.0% - 11.5% ] 11.22% | 799,395 | 18.5% |
[ 11.5% - 12.0% ] 11.80% | 1,080,881 | 20.9% |
[ 12.0% - 12.5% ] 12.25% | 646,579 | 19.9% |
[ 12.5% - 13.0% ] 12.84% | 4,753,618 | 18.1% |
[ 13.0% - 13.5% ] 13.27% | 804,526 | 22.4% |
[ 13.5% - 14.0% ] 13.79% | 825,051 | 24.4% |
[ 14.0% - 14.5% ] 14.31% | 889,742 | 20.2% |
[ 14.5% - 15.0% ] 14.73% | 442,558 | 24.8% |
[ 15.0% - 15.5% ] 15.17% | 397,485 | 20.0% |
[ 15.5% - 16.0% ] 15.72% | 444,773 | 17.8% |
[ 16.0% - 16.5% ] 16.33% | 833,129 | 20.3% |
[ 16.5% - 17.0% ] 16.74% | 537,514 | 18.1% |
[ 17.0% - 17.5% ] 17.16% | 384,954 | 19.7% |
[ 17.5% - 18.0% ] 17.84% | 297,122 | 26.2% |
[ 18.0% - 18.5% ] 18.37% | 53,699 | 11.2% |
[ 18.5% - 19.0% ] 18.84% | 669,010 | 24.0% |
[ 19.0% - 19.5% ] 19.23% | 108,359 | 23.0% |
[ 19.5% - 20.0% ] 19.76% | 248,099 | 20.4% |
[ 20.0% - 20.5% ] 20.14% | 206,432 | 27.1% |
[ 20.5% - 21.0% ] 20.76% | 170,564 | 29.2% |
[ 21.0% - 21.5% ] 21.28% | 254,157 | 22.1% |
[ 21.5% - 22.0% ] 21.63% | 107,458 | 20.6% |
[ 22.0% - 22.5% ] 22.31% | 75,746 | 37.0% |
[ 22.5% - 23.0% ] 22.87% | 187,299 | 18.3% |
[ 23.0% - 23.5% ] 23.19% | 141,865 | 11.3% |
[ 23.5% - 24.0% ] 23.86% | 12,949 | 33.4% |
[ 24.0% - 24.5% ] 24.18% | 183,890 | 26.1% |
[ 24.5% - 25.0% ] 24.80% | 179,714 | 17.1% |
[ 25.0% - 25.5% ] 25.27% | 119,938 | 19.7% |
[ 25.5% - 26.0% ] 25.77% | 250,986 | 20.4% |
[ 26.0% - 26.5% ] 26.24% | 222,979 | 22.0% |
[ 26.5% - 27.0% ] 26.79% | 257,681 | 20.4% |
[ 27.0% - 27.5% ] 27.25% | 17,171 | 11.1% |
[ 27.5% - 28.0% ] 27.62% | 152,945 | 26.6% |
[ 28.0% - 28.5% ] 28.21% | 47,274 | 18.3% |
[ 28.5% - 29.0% ] 28.67% | 57,519 | 18.9% |
[ 29.0% - 29.5% ] 29.17% | 107,395 | 16.5% |
[ 29.5% - 30.0% ] 29.76% | 115,067 | 18.1% |
[ 30.0% - 30.5% ] 30.32% | 123,814 | 21.1% |
[ 30.5% - 31.0% ] 30.77% | 207,269 | 23.7% |
[ 31.0% - 31.5% ] 31.04% | 97,556 | 23.3% |
[ 31.5% - 32.0% ] 31.64% | 62,846 | 11.1% |
[ 32.0% - 32.5% ] 32.32% | 135,919 | 12.2% |
[ 32.5% - 33.0% ] 32.90% | 24,660 | 2.7% |
[ 33.0% - 33.5% ] 33.17% | 77,314 | 15.2% |
[ 33.5% - 34.0% ] 33.56% | 33,122 | 25.4% |
[ 34.0% - 34.5% ] 34.38% | 10,639 | 32.3% |
[ 34.5% - 35.0% ] 34.73% | 59,607 | 25.3% |
[ 35.0% - 35.5% ] 35.20% | 9,444 | 23.2% |
[ 35.5% - 36.0% ] 35.69% | 33,018 | 28.5% |
[ 36.0% - 36.5% ] 36.32% | 1,473 | 5.0% |
[ 36.5% - 37.0% ] 36.65% | 96,220 | 18.2% |
[ 37.0% - 37.5% ] 37.05% | 19,289 | 43.3% |
[ 37.5% - 38.0% ] 37.61% | 10,563 | 37.1% |
[ 38.0% - 38.5% ] 38.45% | 684 | 23.5% |
[ 38.5% - 39.0% ] 38.65% | 39,220 | 23.1% |
[ 39.0% - 39.5% ] 39.46% | 25,324 | 31.0% |
[ 39.5% - 40.0% ] 39.63% | 1,996 | 33.7% |
[ 40.0% - 40.5% ] 40.10% | 17,564 | 26.7% |
[ 40.5% - 41.0% ] 40.86% | 15,109 | 37.1% |
[ 41.0% - 41.5% ] 41.21% | 18,695 | 18.5% |
[ 41.5% - 42.0% ] 41.78% | 1,764 | 31.8% |
[ 42.5% - 43.0% ] 42.98% | 114 | 30.5% |
[ 45.0% - 45.5% ] 45.12% | 79,765 | 15.6% |
[ 46.0% - 46.5% ] 46.36% | 2,118 | 4.9% |
[ 46.5% - 47.0% ] 46.92% | 211 | 44.8% |
[ 52.0% - 52.5% ] 52.21% | 113 | 30.0% |
[ 57.5% - 58.0% ] 57.69% | 182 | 27.7% |
[ 59.5% - 60.0% ] 59.89% | 1,112 | 33.9% |
[ 60.0% - 60.5% ] 60.18% | 50,387 | 23.5% |
[ 61.0% - 61.5% ] 61.24% | 129 | 9.9% |
[ 77.0% - 77.5% ] 77.31% | 21,778 | 27.8% |