South American Indian Wage/Income Gap

COMPARE

South American Indian
Race
Ancestry
AfghanAfricanAlaska NativeAlaskan AthabascanAlbanianAleutAlsatianAmericanApacheArabArapahoArgentineanArmenianAssyrian/Chaldean/SyriacAustralianAustrianBahamianBangladeshiBarbadianBasqueBelgianBelizeanBermudanBhutaneseBlackfeetBolivianBrazilianBritishBritish West IndianBulgarianBurmeseCajunCambodianCanadianCape VerdeanCarpatho RusynCelticCentral AmericanCentral American IndianCherokeeCheyenneChickasawChileanChineseChippewaChoctawColombianColvilleComancheCosta RicanCreeCreekCroatianCrowCubanCypriotCzechCzechoslovakianDanishDelawareDominicanDutchDutch West IndianEastern EuropeanEcuadorianEgyptianEnglishEstonianEthiopianEuropeanFijianFilipinoFinnishFrenchFrench American IndianFrench CanadianGermanGerman RussianGhanaianGreekGuamanian/ChamorroGuatemalanGuyaneseHaitianHmongHonduranHopiHoumaHungarianIcelanderIndian (Asian)IndonesianInupiatIranianIraqiIrishIroquoisIsraeliItalianJamaicanJapaneseJordanianKenyanKiowaKoreanLaotianLatvianLebaneseLiberianLithuanianLumbeeLuxembourgerMacedonianMalaysianMalteseMarshalleseMenomineeMexicanMexican American IndianMongolianMoroccanNative HawaiianNavajoNepaleseNew ZealanderNicaraguanNigerianNorthern EuropeanNorwegianOkinawanOsageOttawaPaiutePakistaniPalestinianPanamanianParaguayanPennsylvania GermanPeruvianPimaPolishPortuguesePotawatomiPuebloPuerto RicanPuget Sound SalishRomanianRussianSalvadoranSamoanScandinavianScotch-IrishScottishSeminoleSenegaleseSerbianShoshoneSierra LeoneanSiouxSlavicSlovakSloveneSomaliSouth AfricanSouth AmericanSouth American IndianSoviet UnionSpaniardSpanishSpanish AmericanSpanish American IndianSri LankanSubsaharan AfricanSudaneseSwedishSwissSyrianTaiwaneseThaiTlingit-HaidaTohono O'OdhamTonganTrinidadian and TobagonianTsimshianTurkishU.S. Virgin IslanderUgandanUkrainianUruguayanUteVenezuelanVietnameseWelshWest IndianYakamaYaquiYugoslavianYumanYup'ikZimbabwean
Immigration
NonimmigrantsImmigrantsAfghanistanAfricaAlbaniaArgentinaArmeniaAsiaAustraliaAustriaBahamasBangladeshBarbadosBelarusBelgiumBelizeBoliviaBosnia and HerzegovinaBrazilBulgariaBurma/MyanmarCabo VerdeCambodiaCameroonCanadaCaribbeanCentral AmericaChileChinaColombiaCongoCosta RicaCroatiaCubaCzechoslovakiaDenmarkDominicaDominican RepublicEastern AfricaEastern AsiaEastern EuropeEcuadorEgyptEl SalvadorEnglandEritreaEthiopiaEuropeFijiFranceGermanyGhanaGreeceGrenadaGuatemalaGuyanaHaitiHondurasHong KongHungaryIndiaIndonesiaIranIraqIrelandIsraelItalyJamaicaJapanJordanKazakhstanKenyaKoreaKuwaitLaosLatin AmericaLatviaLebanonLiberiaLithuaniaMalaysiaMexicoMicronesiaMiddle AfricaMoldovaMoroccoNepalNetherlandsNicaraguaNigeriaNorth AmericaNorth MacedoniaNorthern AfricaNorthern EuropeNorwayOceaniaPakistanPanamaPeruPhilippinesPolandPortugalRomaniaRussiaSaudi ArabiaScotlandSenegalSerbiaSierra LeoneSingaporeSomaliaSouth AfricaSouth AmericaSouth Central AsiaSouth Eastern AsiaSouthern EuropeSpainSri LankaSt. Vincent and the GrenadinesSudanSwedenSwitzerlandSyriaTaiwanThailandTrinidad and TobagoTurkeyUgandaUkraineUruguayUzbekistanVenezuelaVietnamWest IndiesWestern AfricaWestern AsiaWestern EuropeYemenZaireZimbabweAzores
Select to Compare
Race
Ancestry
AfghanAfricanAlaska NativeAlaskan AthabascanAlbanianAleutAlsatianAmericanApacheArabArapahoArgentineanArmenianAssyrian/Chaldean/SyriacAustralianAustrianBahamianBangladeshiBarbadianBasqueBelgianBelizeanBermudanBhutaneseBlackfeetBolivianBrazilianBritishBritish West IndianBulgarianBurmeseCajunCambodianCanadianCape VerdeanCarpatho RusynCelticCentral AmericanCentral American IndianCherokeeCheyenneChickasawChileanChineseChippewaChoctawColombianColvilleComancheCosta RicanCreeCreekCroatianCrowCubanCypriotCzechCzechoslovakianDanishDelawareDominicanDutchDutch West IndianEastern EuropeanEcuadorianEgyptianEnglishEstonianEthiopianEuropeanFijianFilipinoFinnishFrenchFrench American IndianFrench CanadianGermanGerman RussianGhanaianGreekGuamanian/ChamorroGuatemalanGuyaneseHaitianHmongHonduranHopiHoumaHungarianIcelanderIndian (Asian)IndonesianInupiatIranianIraqiIrishIroquoisIsraeliItalianJamaicanJapaneseJordanianKenyanKiowaKoreanLaotianLatvianLebaneseLiberianLithuanianLumbeeLuxembourgerMacedonianMalaysianMalteseMarshalleseMenomineeMexicanMexican American IndianMongolianMoroccanNative HawaiianNavajoNepaleseNew ZealanderNicaraguanNigerianNorthern EuropeanNorwegianOkinawanOsageOttawaPaiutePakistaniPalestinianPanamanianParaguayanPennsylvania GermanPeruvianPimaPolishPortuguesePotawatomiPuebloPuerto RicanPuget Sound SalishRomanianRussianSalvadoranSamoanScandinavianScotch-IrishScottishSeminoleSenegaleseSerbianShoshoneSierra LeoneanSiouxSlavicSlovakSloveneSomaliSouth AfricanSouth AmericanSoviet UnionSpaniardSpanishSpanish AmericanSpanish American IndianSri LankanSubsaharan AfricanSudaneseSwedishSwissSyrianTaiwaneseThaiTlingit-HaidaTohono O'OdhamTonganTrinidadian and TobagonianTsimshianTurkishU.S. Virgin IslanderUgandanUkrainianUruguayanUteVenezuelanVietnameseWelshWest IndianYakamaYaquiYugoslavianYumanYup'ikZimbabwean
Immigration
NonimmigrantsImmigrantsAfghanistanAfricaAlbaniaArgentinaArmeniaAsiaAustraliaAustriaBahamasBangladeshBarbadosBelarusBelgiumBelizeBoliviaBosnia and HerzegovinaBrazilBulgariaBurma/MyanmarCabo VerdeCambodiaCameroonCanadaCaribbeanCentral AmericaChileChinaColombiaCongoCosta RicaCroatiaCubaCzechoslovakiaDenmarkDominicaDominican RepublicEastern AfricaEastern AsiaEastern EuropeEcuadorEgyptEl SalvadorEnglandEritreaEthiopiaEuropeFijiFranceGermanyGhanaGreeceGrenadaGuatemalaGuyanaHaitiHondurasHong KongHungaryIndiaIndonesiaIranIraqIrelandIsraelItalyJamaicaJapanJordanKazakhstanKenyaKoreaKuwaitLaosLatin AmericaLatviaLebanonLiberiaLithuaniaMalaysiaMexicoMicronesiaMiddle AfricaMoldovaMoroccoNepalNetherlandsNicaraguaNigeriaNorth AmericaNorth MacedoniaNorthern AfricaNorthern EuropeNorwayOceaniaPakistanPanamaPeruPhilippinesPolandPortugalRomaniaRussiaSaudi ArabiaScotlandSenegalSerbiaSierra LeoneSingaporeSomaliaSouth AfricaSouth AmericaSouth Central AsiaSouth Eastern AsiaSouthern EuropeSpainSri LankaSt. Vincent and the GrenadinesSudanSwedenSwitzerlandSyriaTaiwanThailandTrinidad and TobagoTurkeyUgandaUkraineUruguayUzbekistanVenezuelaVietnamWest IndiesWestern AfricaWestern AsiaWestern EuropeYemenZaireZimbabweAzores
Wage/Income Gap
Income
Poverty
Unemployment
Labor Participation
Family Structure
Vehicle Availability
Education Level
Disability

South American Indian Wage/Income Gap
Exceptional

24.7%
WAGE/INCOME GAP
92.0/ 100
METRIC RATING
135th/ 347
METRIC RANK

South American Indian Wage/Income Gap Correlation Chart

The statistical analysis conducted on geographies consisting of 164,540,289 people shows a poor positive correlation between the proportion of South American Indians and wage/income gap percentage in the United States with a correlation coefficient (R) of 0.145 and weighted average of 24.7%. On average, for every 1% (one percent) increase in South American Indians within a typical geography, there is an increase of 0.45% in wage/income gap percentage.
South American Indian Wage/Income Gap
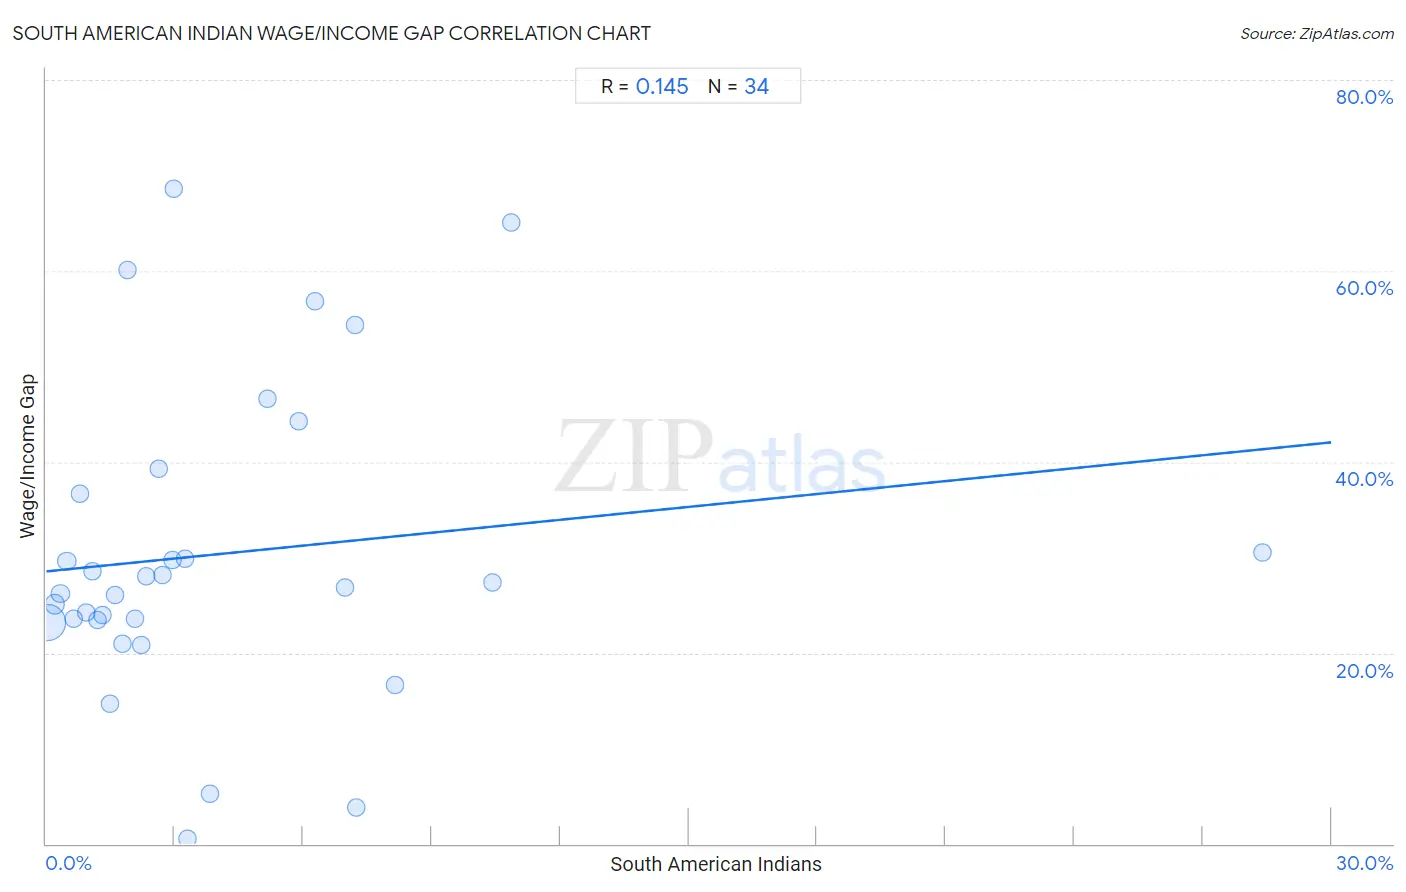
It is essential to understand that the correlation between the percentage of South American Indians and wage/income gap percentage does not imply a direct cause-and-effect relationship. It remains uncertain whether the presence of South American Indians influences an upward or downward trend in the level of wage/income gap percentage within an area, or if South American Indians simply ended up residing in those areas with higher or lower levels of wage/income gap percentage due to other factors.

Demographics Similar to South American Indians by Wage/Income Gap

In terms of wage/income gap, the demographic groups most similar to South American Indians are Mexican American Indian (24.7%, a difference of 0.060%), Colombian (24.7%, a difference of 0.090%), Immigrants from Costa Rica (24.7%, a difference of 0.10%), Armenian (24.8%, a difference of 0.14%), and Immigrants from South Eastern Asia (24.8%, a difference of 0.23%).
DemographicsRating | RankWage/Income Gap
Immigrants from Central America
93.5
/100
|
#128
Exceptional
24.6%
Yup'ik
93.3
/100
|
#129
Exceptional
24.7%
Alsatians
93.2
/100
|
#130
Exceptional
24.7%
Immigrants from Philippines
93.0
/100
|
#131
Exceptional
24.7%
Immigrants from Costa Rica
92.4
/100
|
#132
Exceptional
24.7%
Colombians
92.4
/100
|
#133
Exceptional
24.7%
Mexican American Indians
92.2
/100
|
#134
Exceptional
24.7%
South American Indians
92.0
/100
|
#135
Exceptional
24.7%
Armenians
91.3
/100
|
#136
Exceptional
24.8%
Immigrants from South Eastern Asia
90.9
/100
|
#137
Exceptional
24.8%
Immigrants from Bosnia and Herzegovina
90.1
/100
|
#138
Exceptional
24.8%
Hispanics or Latinos
89.5
/100
|
#139
Excellent
24.9%
Immigrants from Nepal
89.3
/100
|
#140
Excellent
24.9%
Hawaiians
89.3
/100
|
#141
Excellent
24.9%
Afghans
88.1
/100
|
#142
Excellent
24.9%

South American Indian Wage/Income Gap Correlation Summary

MeasurementSouth American Indian DataWage/Income Gap Data
Minimum0.038%0.52%
Maximum28.4%68.7%
Range28.3%68.1%
Mean4.1%30.4%
Median2.5%27.1%
Interquartile 25% (IQ1)1.2%23.4%
Interquartile 75% (IQ3)5.9%36.7%
Interquartile Range (IQR)4.7%13.2%
Standard Deviation (Sample)5.2%16.2%
Standard Deviation (Population)5.1%15.9%

Correlation Details

South American Indian PercentileSample SizeWage/Income Gap
[
0.0%
-
0.5%
]
0.038%
145,868,07523.2%
[
0.0%
-
0.5%
]
0.20%
12,421,65425.1%
[
0.0%
-
0.5%
]
0.33%
3,280,39726.2%
[
0.0%
-
0.5%
]
0.48%
1,021,70829.6%
[
0.5%
-
1.0%
]
0.63%
856,43723.6%
[
0.5%
-
1.0%
]
0.78%
365,32236.7%
[
0.5%
-
1.0%
]
0.93%
110,85524.3%
[
1.0%
-
1.5%
]
1.07%
207,68828.5%
[
1.0%
-
1.5%
]
1.19%
105,98723.4%
[
1.0%
-
1.5%
]
1.32%
121,18524.0%
[
1.0%
-
1.5%
]
1.48%
34,88714.7%
[
1.5%
-
2.0%
]
1.61%
19,82426.1%
[
1.5%
-
2.0%
]
1.77%
23,02821.0%
[
1.5%
-
2.0%
]
1.90%
11,44860.1%
[
2.0%
-
2.5%
]
2.07%
2,41923.6%
[
2.0%
-
2.5%
]
2.22%
34,79820.8%
[
2.0%
-
2.5%
]
2.33%
1,59028.0%
[
2.5%
-
3.0%
]
2.63%
1,67639.3%
[
2.5%
-
3.0%
]
2.71%
14,23528.2%
[
2.5%
-
3.0%
]
2.95%
6,29929.8%
[
2.5%
-
3.0%
]
2.99%
1,17268.7%
[
3.0%
-
3.5%
]
3.23%
13,11129.9%
[
3.0%
-
3.5%
]
3.29%
1,0350.52%
[
3.5%
-
4.0%
]
3.84%
3,8835.2%
[
5.0%
-
5.5%
]
5.15%
29146.6%
[
5.5%
-
6.0%
]
5.90%
2,17044.2%
[
6.0%
-
6.5%
]
6.27%
55856.8%
[
6.5%
-
7.0%
]
6.98%
3,78126.8%
[
7.0%
-
7.5%
]
7.20%
62554.4%
[
7.0%
-
7.5%
]
7.25%
2,0843.8%
[
8.0%
-
8.5%
]
8.14%
1,05616.7%
[
10.0%
-
10.5%
]
10.42%
43227.4%
[
10.5%
-
11.0%
]
10.87%
27665.0%
[
28.0%
-
28.5%
]
28.38%
30330.5%