Immigrants from England Wage/Income Gap
COMPARE
Immigrants from England
Select to Compare
Wage/Income Gap
Immigrants from England Wage/Income Gap
27.9%
WAGE/INCOME GAP
0.6/ 100
METRIC RATING
278th/ 347
METRIC RANK
Immigrants from England Wage/Income Gap Correlation Chart
The statistical analysis conducted on geographies consisting of 391,474,935 people shows a poor positive correlation between the proportion of Immigrants from England and wage/income gap percentage in the United States with a correlation coefficient (R) of 0.167 and weighted average of 27.9%. On average, for every 1% (one percent) increase in Immigrants from England within a typical geography, there is an increase of 0.62% in wage/income gap percentage.
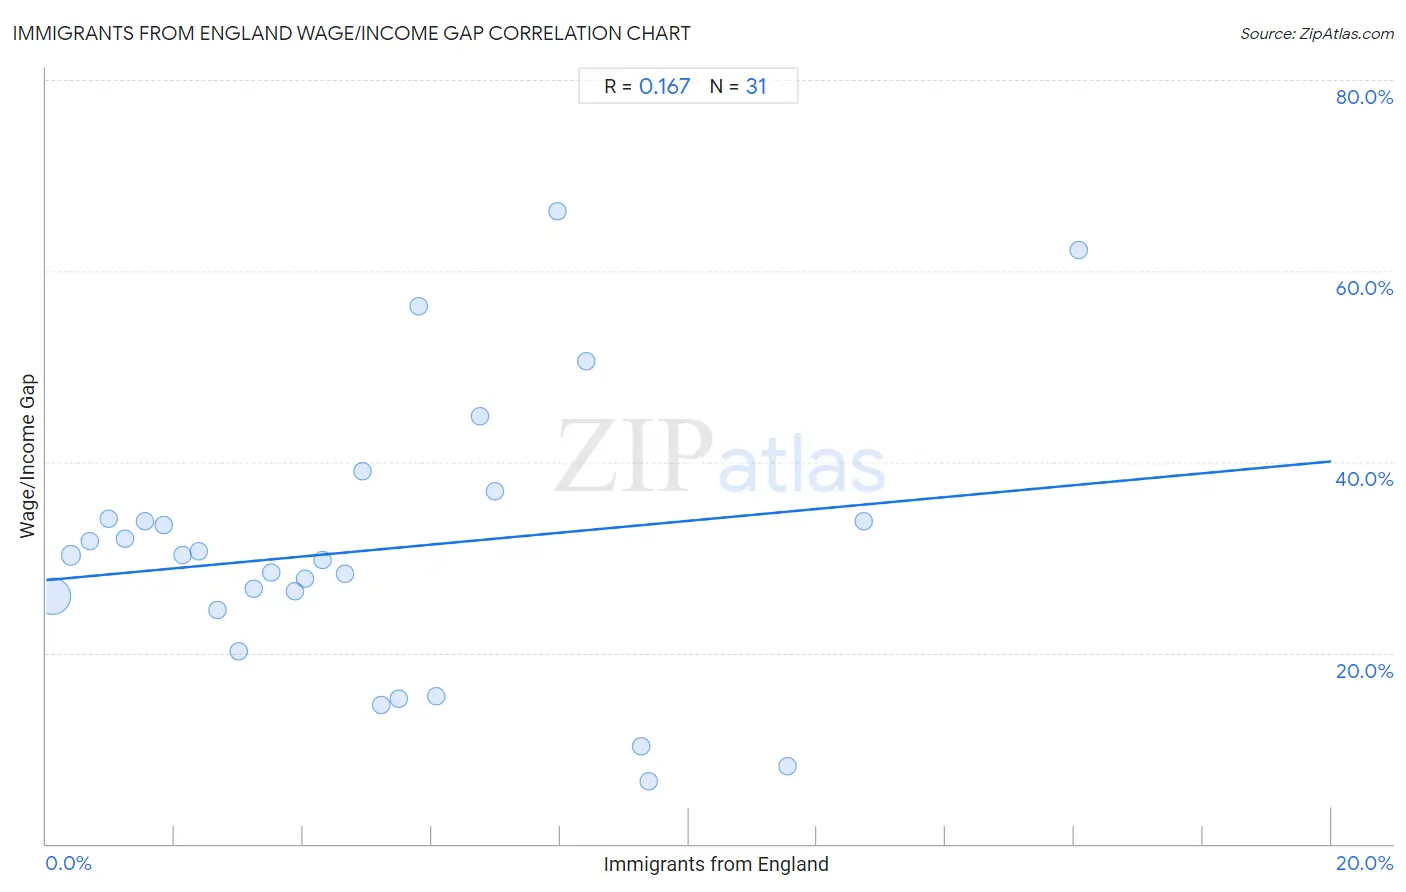
It is essential to understand that the correlation between the percentage of Immigrants from England and wage/income gap percentage does not imply a direct cause-and-effect relationship. It remains uncertain whether the presence of Immigrants from England influences an upward or downward trend in the level of wage/income gap percentage within an area, or if Immigrants from England simply ended up residing in those areas with higher or lower levels of wage/income gap percentage due to other factors.
Demographics Similar to Immigrants from England by Wage/Income Gap
In terms of wage/income gap, the demographic groups most similar to Immigrants from England are Lebanese (27.9%, a difference of 0.080%), Latvian (27.9%, a difference of 0.080%), Immigrants from Japan (27.9%, a difference of 0.11%), American (27.8%, a difference of 0.19%), and Bulgarian (27.8%, a difference of 0.23%).
| Demographics | Rating | Rank | Wage/Income Gap |
| Ute | 0.8 /100 | #271 | Tragic 27.8% |
| Immigrants from Korea | 0.8 /100 | #272 | Tragic 27.8% |
| Bulgarians | 0.7 /100 | #273 | Tragic 27.8% |
| Americans | 0.7 /100 | #274 | Tragic 27.8% |
| Immigrants from Japan | 0.7 /100 | #275 | Tragic 27.9% |
| Lebanese | 0.7 /100 | #276 | Tragic 27.9% |
| Latvians | 0.7 /100 | #277 | Tragic 27.9% |
| Immigrants from England | 0.6 /100 | #278 | Tragic 27.9% |
| Romanians | 0.5 /100 | #279 | Tragic 28.0% |
| Russians | 0.5 /100 | #280 | Tragic 28.0% |
| Burmese | 0.5 /100 | #281 | Tragic 28.0% |
| South Africans | 0.5 /100 | #282 | Tragic 28.0% |
| French Canadians | 0.4 /100 | #283 | Tragic 28.1% |
| Immigrants from Sweden | 0.4 /100 | #284 | Tragic 28.1% |
| Italians | 0.4 /100 | #285 | Tragic 28.1% |
Immigrants from England Wage/Income Gap Correlation Summary
| Measurement | Immigrants from England Data | Wage/Income Gap Data |
| Minimum | 0.098% | 6.6% |
| Maximum | 16.1% | 66.3% |
| Range | 16.0% | 59.7% |
| Mean | 5.1% | 30.8% |
| Median | 4.3% | 30.2% |
| Interquartile 25% (IQ1) | 2.1% | 24.5% |
| Interquartile 75% (IQ3) | 7.0% | 34.1% |
| Interquartile Range (IQR) | 4.9% | 9.6% |
| Standard Deviation (Sample) | 3.8% | 14.3% |
| Standard Deviation (Population) | 3.8% | 14.0% |
Correlation Details
| Immigrants from England Percentile | Sample Size | Wage/Income Gap |
[ 0.0% - 0.5% ] 0.098% | 347,247,218 | 26.0% |
[ 0.0% - 0.5% ] 0.38% | 34,694,120 | 30.2% |
[ 0.5% - 1.0% ] 0.68% | 6,468,047 | 31.7% |
[ 0.5% - 1.0% ] 0.97% | 1,700,128 | 34.1% |
[ 1.0% - 1.5% ] 1.23% | 690,134 | 31.9% |
[ 1.5% - 2.0% ] 1.53% | 280,323 | 33.8% |
[ 1.5% - 2.0% ] 1.82% | 127,699 | 33.4% |
[ 2.0% - 2.5% ] 2.12% | 71,287 | 30.2% |
[ 2.0% - 2.5% ] 2.37% | 57,447 | 30.6% |
[ 2.5% - 3.0% ] 2.67% | 27,133 | 24.5% |
[ 3.0% - 3.5% ] 3.00% | 30,099 | 20.1% |
[ 3.0% - 3.5% ] 3.23% | 20,835 | 26.7% |
[ 3.0% - 3.5% ] 3.49% | 8,643 | 28.4% |
[ 3.5% - 4.0% ] 3.87% | 1,241 | 26.5% |
[ 4.0% - 4.5% ] 4.03% | 5,290 | 27.7% |
[ 4.0% - 4.5% ] 4.29% | 13,464 | 29.8% |
[ 4.5% - 5.0% ] 4.65% | 13,486 | 28.3% |
[ 4.5% - 5.0% ] 4.93% | 8,317 | 39.0% |
[ 5.0% - 5.5% ] 5.21% | 4,049 | 14.5% |
[ 5.0% - 5.5% ] 5.48% | 1,132 | 15.2% |
[ 5.5% - 6.0% ] 5.79% | 570 | 56.2% |
[ 6.0% - 6.5% ] 6.06% | 429 | 15.4% |
[ 6.5% - 7.0% ] 6.75% | 311 | 44.8% |
[ 6.5% - 7.0% ] 6.99% | 901 | 36.9% |
[ 7.5% - 8.0% ] 7.96% | 226 | 66.3% |
[ 8.0% - 8.5% ] 8.41% | 345 | 50.5% |
[ 9.0% - 9.5% ] 9.26% | 842 | 10.2% |
[ 9.0% - 9.5% ] 9.38% | 437 | 6.6% |
[ 11.5% - 12.0% ] 11.54% | 130 | 8.1% |
[ 12.5% - 13.0% ] 12.71% | 291 | 33.8% |
[ 16.0% - 16.5% ] 16.07% | 361 | 62.1% |