Seminole vs Immigrants from Poland Wage/Income Gap
COMPARE
Seminole
Immigrants from Poland
Wage/Income Gap
Wage/Income Gap Comparison
Seminole
Immigrants from Poland
25.6%
WAGE/INCOME GAP
62.6/ 100
METRIC RATING
168th/ 347
METRIC RANK
26.7%
WAGE/INCOME GAP
8.9/ 100
METRIC RATING
219th/ 347
METRIC RANK
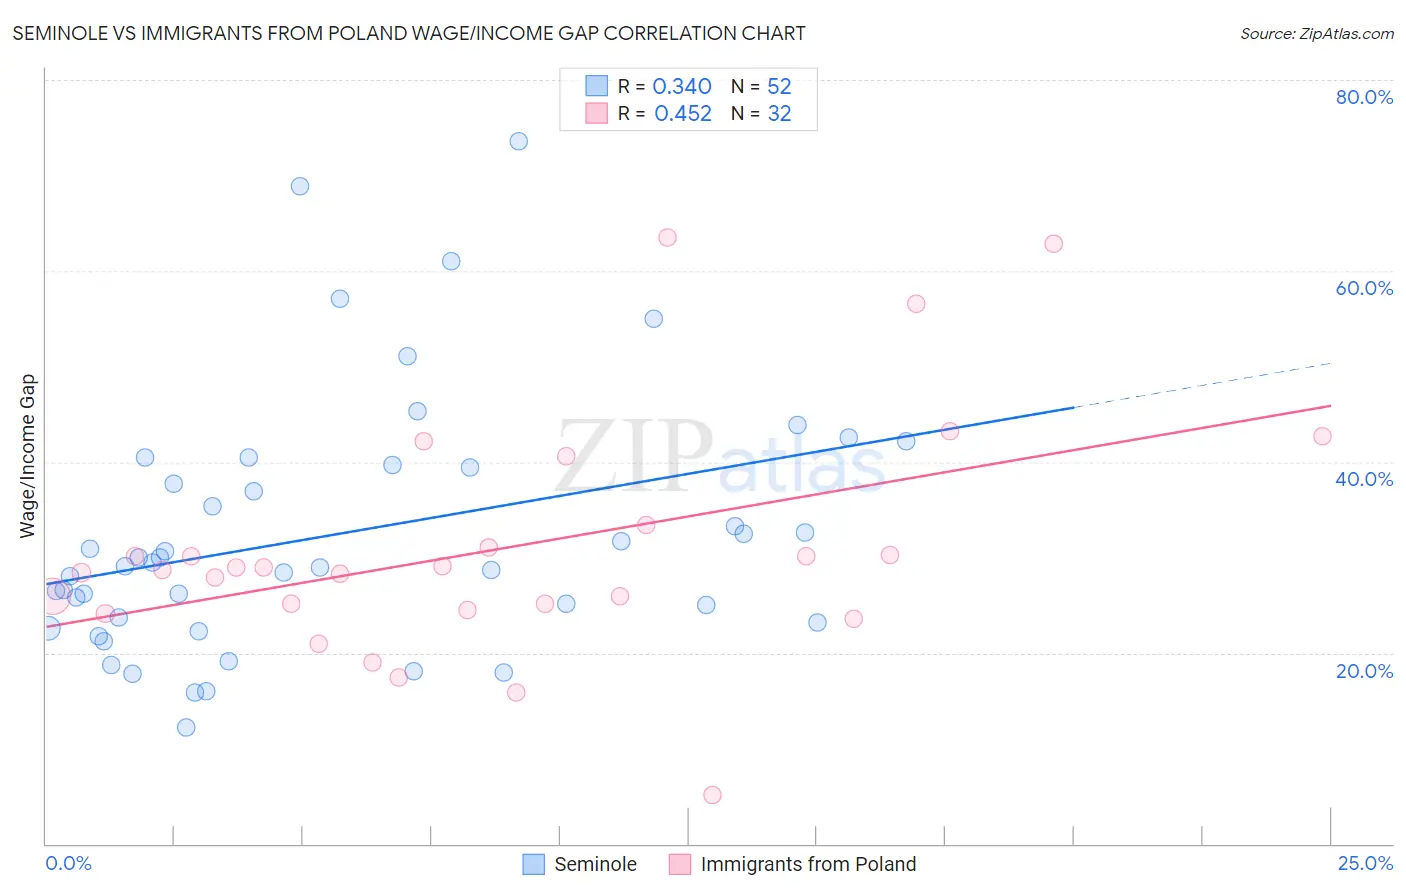
Seminole vs Immigrants from Poland Wage/Income Gap Correlation Chart
The statistical analysis conducted on geographies consisting of 118,242,273 people shows a mild positive correlation between the proportion of Seminole and wage/income gap percentage in the United States with a correlation coefficient (R) of 0.340 and weighted average of 25.6%. Similarly, the statistical analysis conducted on geographies consisting of 304,701,845 people shows a moderate positive correlation between the proportion of Immigrants from Poland and wage/income gap percentage in the United States with a correlation coefficient (R) of 0.452 and weighted average of 26.7%, a difference of 4.7%.
Wage/Income Gap Correlation Summary
| Measurement | Seminole | Immigrants from Poland |
| Minimum | 12.2% | 5.1% |
| Maximum | 73.6% | 63.5% |
| Range | 61.3% | 58.4% |
| Mean | 32.4% | 30.9% |
| Median | 29.3% | 28.8% |
| Interquartile 25% (IQ1) | 23.5% | 24.8% |
| Interquartile 75% (IQ3) | 39.5% | 32.3% |
| Interquartile Range (IQR) | 16.1% | 7.5% |
| Standard Deviation (Sample) | 13.3% | 12.5% |
| Standard Deviation (Population) | 13.2% | 12.3% |
Similar Demographics by Wage/Income Gap
Demographics Similar to Seminole by Wage/Income Gap
In terms of wage/income gap, the demographic groups most similar to Seminole are Paiute (25.5%, a difference of 0.020%), Immigrants from Ukraine (25.5%, a difference of 0.080%), Immigrants from Hong Kong (25.5%, a difference of 0.090%), Peruvian (25.6%, a difference of 0.18%), and Immigrants from Oceania (25.6%, a difference of 0.35%).
| Demographics | Rating | Rank | Wage/Income Gap |
| Albanians | 69.4 /100 | #161 | Good 25.4% |
| Shoshone | 69.0 /100 | #162 | Good 25.4% |
| Native Hawaiians | 69.0 /100 | #163 | Good 25.4% |
| Koreans | 68.6 /100 | #164 | Good 25.4% |
| Immigrants | Hong Kong | 64.0 /100 | #165 | Good 25.5% |
| Immigrants | Ukraine | 63.8 /100 | #166 | Good 25.5% |
| Paiute | 62.9 /100 | #167 | Good 25.5% |
| Seminole | 62.6 /100 | #168 | Good 25.6% |
| Peruvians | 60.1 /100 | #169 | Good 25.6% |
| Immigrants | Oceania | 57.5 /100 | #170 | Average 25.6% |
| Immigrants | Greece | 56.6 /100 | #171 | Average 25.7% |
| Immigrants | Chile | 53.2 /100 | #172 | Average 25.7% |
| Immigrants | Belarus | 52.9 /100 | #173 | Average 25.7% |
| Alaskan Athabascans | 50.0 /100 | #174 | Average 25.8% |
| Sri Lankans | 47.0 /100 | #175 | Average 25.8% |
Demographics Similar to Immigrants from Poland by Wage/Income Gap
In terms of wage/income gap, the demographic groups most similar to Immigrants from Poland are Immigrants from Latvia (26.7%, a difference of 0.010%), Immigrants from Saudi Arabia (26.7%, a difference of 0.030%), Brazilian (26.7%, a difference of 0.050%), Immigrants from Spain (26.8%, a difference of 0.080%), and Immigrants from Portugal (26.7%, a difference of 0.11%).
| Demographics | Rating | Rank | Wage/Income Gap |
| Iraqis | 11.2 /100 | #212 | Poor 26.6% |
| Immigrants | Iraq | 10.3 /100 | #213 | Poor 26.7% |
| Immigrants | China | 10.3 /100 | #214 | Poor 26.7% |
| Yugoslavians | 9.7 /100 | #215 | Tragic 26.7% |
| Immigrants | Portugal | 9.5 /100 | #216 | Tragic 26.7% |
| Brazilians | 9.2 /100 | #217 | Tragic 26.7% |
| Immigrants | Saudi Arabia | 9.1 /100 | #218 | Tragic 26.7% |
| Immigrants | Poland | 8.9 /100 | #219 | Tragic 26.7% |
| Immigrants | Latvia | 8.9 /100 | #220 | Tragic 26.7% |
| Immigrants | Spain | 8.5 /100 | #221 | Tragic 26.8% |
| Bolivians | 8.3 /100 | #222 | Tragic 26.8% |
| Jordanians | 8.0 /100 | #223 | Tragic 26.8% |
| Immigrants | Argentina | 7.2 /100 | #224 | Tragic 26.8% |
| Immigrants | Ireland | 6.5 /100 | #225 | Tragic 26.9% |
| Asians | 5.9 /100 | #226 | Tragic 26.9% |