Guyanese Wage/Income Gap
COMPARE
Guyanese
Select to Compare
Wage/Income Gap
Guyanese Wage/Income Gap
18.3%
WAGE/INCOME GAP
100.0/ 100
METRIC RATING
5th/ 347
METRIC RANK
Guyanese Wage/Income Gap Correlation Chart
The statistical analysis conducted on geographies consisting of 176,905,997 people shows a poor negative correlation between the proportion of Guyanese and wage/income gap percentage in the United States with a correlation coefficient (R) of -0.106 and weighted average of 18.3%. On average, for every 1% (one percent) increase in Guyanese within a typical geography, there is a decrease of 0.24% in wage/income gap percentage.
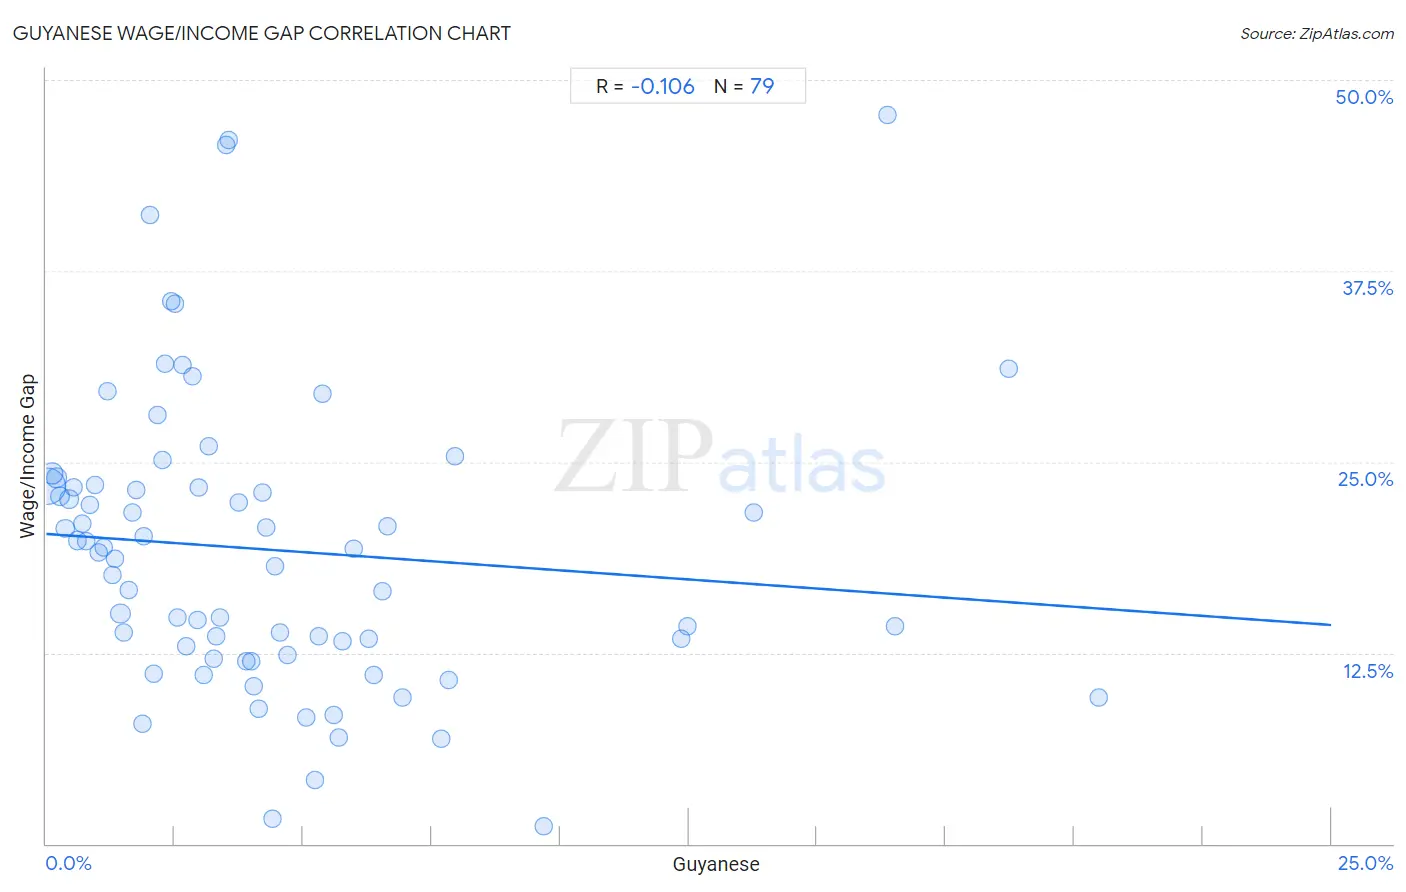
It is essential to understand that the correlation between the percentage of Guyanese and wage/income gap percentage does not imply a direct cause-and-effect relationship. It remains uncertain whether the presence of Guyanese influences an upward or downward trend in the level of wage/income gap percentage within an area, or if Guyanese simply ended up residing in those areas with higher or lower levels of wage/income gap percentage due to other factors.
Demographics Similar to Guyanese by Wage/Income Gap
In terms of wage/income gap, the demographic groups most similar to Guyanese are Immigrants from Guyana (18.4%, a difference of 0.26%), British West Indian (18.0%, a difference of 1.6%), Puerto Rican (18.7%, a difference of 2.3%), Immigrants from Barbados (17.8%, a difference of 2.6%), and Immigrants from Jamaica (18.8%, a difference of 2.9%).
| Demographics | Rating | Rank | Wage/Income Gap |
| Immigrants from Grenada | 100.0 /100 | #1 | Exceptional 16.2% |
| Immigrants from St. Vincent and the Grenadines | 100.0 /100 | #2 | Exceptional 16.4% |
| Immigrants from Barbados | 100.0 /100 | #3 | Exceptional 17.8% |
| British West Indians | 100.0 /100 | #4 | Exceptional 18.0% |
| Guyanese | 100.0 /100 | #5 | Exceptional 18.3% |
| Immigrants from Guyana | 100.0 /100 | #6 | Exceptional 18.4% |
| Puerto Ricans | 100.0 /100 | #7 | Exceptional 18.7% |
| Immigrants from Jamaica | 100.0 /100 | #8 | Exceptional 18.8% |
| Barbadians | 100.0 /100 | #9 | Exceptional 19.0% |
| Crow | 100.0 /100 | #10 | Exceptional 19.1% |
| Immigrants from Haiti | 100.0 /100 | #11 | Exceptional 19.2% |
| Immigrants from West Indies | 100.0 /100 | #12 | Exceptional 19.2% |
| Trinidadians and Tobagonians | 100.0 /100 | #13 | Exceptional 19.3% |
| Immigrants from Trinidad and Tobago | 100.0 /100 | #14 | Exceptional 19.3% |
| West Indians | 100.0 /100 | #15 | Exceptional 19.6% |
Guyanese Wage/Income Gap Correlation Summary
| Measurement | Guyanese Data | Wage/Income Gap Data |
| Minimum | 0.028% | 1.1% |
| Maximum | 20.5% | 47.7% |
| Range | 20.5% | 46.5% |
| Mean | 4.4% | 19.2% |
| Median | 3.3% | 19.1% |
| Interquartile 25% (IQ1) | 1.6% | 12.4% |
| Interquartile 75% (IQ3) | 5.6% | 23.4% |
| Interquartile Range (IQR) | 4.0% | 11.0% |
| Standard Deviation (Sample) | 4.3% | 9.6% |
| Standard Deviation (Population) | 4.2% | 9.6% |
Correlation Details
| Guyanese Percentile | Sample Size | Wage/Income Gap |
[ 0.0% - 0.5% ] 0.028% | 105,616,527 | 23.4% |
[ 0.0% - 0.5% ] 0.12% | 24,633,384 | 24.2% |
[ 0.0% - 0.5% ] 0.20% | 10,493,657 | 24.0% |
[ 0.0% - 0.5% ] 0.28% | 7,262,196 | 22.7% |
[ 0.0% - 0.5% ] 0.37% | 3,906,724 | 20.7% |
[ 0.0% - 0.5% ] 0.45% | 2,741,644 | 22.5% |
[ 0.5% - 1.0% ] 0.53% | 1,931,512 | 23.4% |
[ 0.5% - 1.0% ] 0.61% | 1,383,154 | 19.9% |
[ 0.5% - 1.0% ] 0.71% | 1,741,449 | 21.0% |
[ 0.5% - 1.0% ] 0.78% | 823,110 | 19.8% |
[ 0.5% - 1.0% ] 0.86% | 1,623,097 | 22.2% |
[ 0.5% - 1.0% ] 0.94% | 261,921 | 23.5% |
[ 1.0% - 1.5% ] 1.02% | 728,753 | 19.1% |
[ 1.0% - 1.5% ] 1.11% | 327,551 | 19.4% |
[ 1.0% - 1.5% ] 1.18% | 200,551 | 29.6% |
[ 1.0% - 1.5% ] 1.28% | 165,217 | 17.6% |
[ 1.0% - 1.5% ] 1.34% | 215,349 | 18.6% |
[ 1.0% - 1.5% ] 1.44% | 9,101,728 | 15.1% |
[ 1.5% - 2.0% ] 1.51% | 97,919 | 13.8% |
[ 1.5% - 2.0% ] 1.60% | 84,644 | 16.6% |
[ 1.5% - 2.0% ] 1.68% | 131,750 | 21.7% |
[ 1.5% - 2.0% ] 1.76% | 129,537 | 23.2% |
[ 1.5% - 2.0% ] 1.86% | 91,105 | 7.9% |
[ 1.5% - 2.0% ] 1.91% | 143,709 | 20.1% |
[ 2.0% - 2.5% ] 2.01% | 33,555 | 41.2% |
[ 2.0% - 2.5% ] 2.09% | 152,542 | 11.1% |
[ 2.0% - 2.5% ] 2.16% | 35,059 | 28.1% |
[ 2.0% - 2.5% ] 2.26% | 107,305 | 25.1% |
[ 2.0% - 2.5% ] 2.32% | 39,894 | 31.4% |
[ 2.0% - 2.5% ] 2.43% | 55,283 | 35.5% |
[ 2.5% - 3.0% ] 2.51% | 22,745 | 35.3% |
[ 2.5% - 3.0% ] 2.56% | 112,496 | 14.8% |
[ 2.5% - 3.0% ] 2.64% | 10,531 | 31.3% |
[ 2.5% - 3.0% ] 2.72% | 87,187 | 12.9% |
[ 2.5% - 3.0% ] 2.84% | 99,750 | 30.6% |
[ 2.5% - 3.0% ] 2.93% | 180,896 | 14.6% |
[ 2.5% - 3.0% ] 2.97% | 44,140 | 23.3% |
[ 3.0% - 3.5% ] 3.07% | 103,918 | 11.0% |
[ 3.0% - 3.5% ] 3.15% | 71,908 | 26.0% |
[ 3.0% - 3.5% ] 3.26% | 66,771 | 12.1% |
[ 3.0% - 3.5% ] 3.31% | 41,511 | 13.6% |
[ 3.0% - 3.5% ] 3.39% | 60,268 | 14.8% |
[ 3.5% - 4.0% ] 3.51% | 4,783 | 45.7% |
[ 3.5% - 4.0% ] 3.55% | 4,734 | 46.0% |
[ 3.5% - 4.0% ] 3.75% | 120,337 | 22.3% |
[ 3.5% - 4.0% ] 3.89% | 156,163 | 11.9% |
[ 3.5% - 4.0% ] 3.98% | 72,273 | 11.9% |
[ 4.0% - 4.5% ] 4.04% | 7,284 | 10.3% |
[ 4.0% - 4.5% ] 4.14% | 11,110 | 8.8% |
[ 4.0% - 4.5% ] 4.22% | 14,367 | 23.0% |
[ 4.0% - 4.5% ] 4.27% | 6,529 | 20.7% |
[ 4.0% - 4.5% ] 4.40% | 39,557 | 1.7% |
[ 4.0% - 4.5% ] 4.46% | 112,720 | 18.2% |
[ 4.5% - 5.0% ] 4.56% | 64,268 | 13.8% |
[ 4.5% - 5.0% ] 4.68% | 131,608 | 12.4% |
[ 5.0% - 5.5% ] 5.05% | 137,948 | 8.3% |
[ 5.0% - 5.5% ] 5.24% | 68,879 | 4.1% |
[ 5.0% - 5.5% ] 5.31% | 21,901 | 13.6% |
[ 5.0% - 5.5% ] 5.37% | 4,562 | 29.5% |
[ 5.5% - 6.0% ] 5.60% | 49,391 | 8.4% |
[ 5.5% - 6.0% ] 5.70% | 31,953 | 7.0% |
[ 5.5% - 6.0% ] 5.75% | 16,374 | 13.2% |
[ 5.5% - 6.0% ] 5.99% | 25,187 | 19.3% |
[ 6.0% - 6.5% ] 6.26% | 2,219 | 13.4% |
[ 6.0% - 6.5% ] 6.37% | 35,154 | 11.0% |
[ 6.5% - 7.0% ] 6.54% | 70,611 | 16.5% |
[ 6.5% - 7.0% ] 6.63% | 108,180 | 20.8% |
[ 6.5% - 7.0% ] 6.93% | 27,794 | 9.6% |
[ 7.5% - 8.0% ] 7.68% | 8,128 | 6.9% |
[ 7.5% - 8.0% ] 7.83% | 138,467 | 10.7% |
[ 7.5% - 8.0% ] 7.96% | 31,200 | 25.4% |
[ 9.5% - 10.0% ] 9.68% | 38,865 | 1.1% |
[ 12.0% - 12.5% ] 12.35% | 7,863 | 13.4% |
[ 12.0% - 12.5% ] 12.47% | 21,349 | 14.2% |
[ 13.5% - 14.0% ] 13.78% | 29,921 | 21.7% |
[ 16.0% - 16.5% ] 16.37% | 3,568 | 47.7% |
[ 16.5% - 17.0% ] 16.52% | 19,554 | 14.2% |
[ 18.5% - 19.0% ] 18.74% | 48,096 | 31.1% |
[ 20.0% - 20.5% ] 20.48% | 51,153 | 9.5% |