Ukrainian Wage/Income Gap
COMPARE
Ukrainian
Select to Compare
Wage/Income Gap
Ukrainian Wage/Income Gap
27.3%
WAGE/INCOME GAP
2.4/ 100
METRIC RATING
252nd/ 347
METRIC RANK
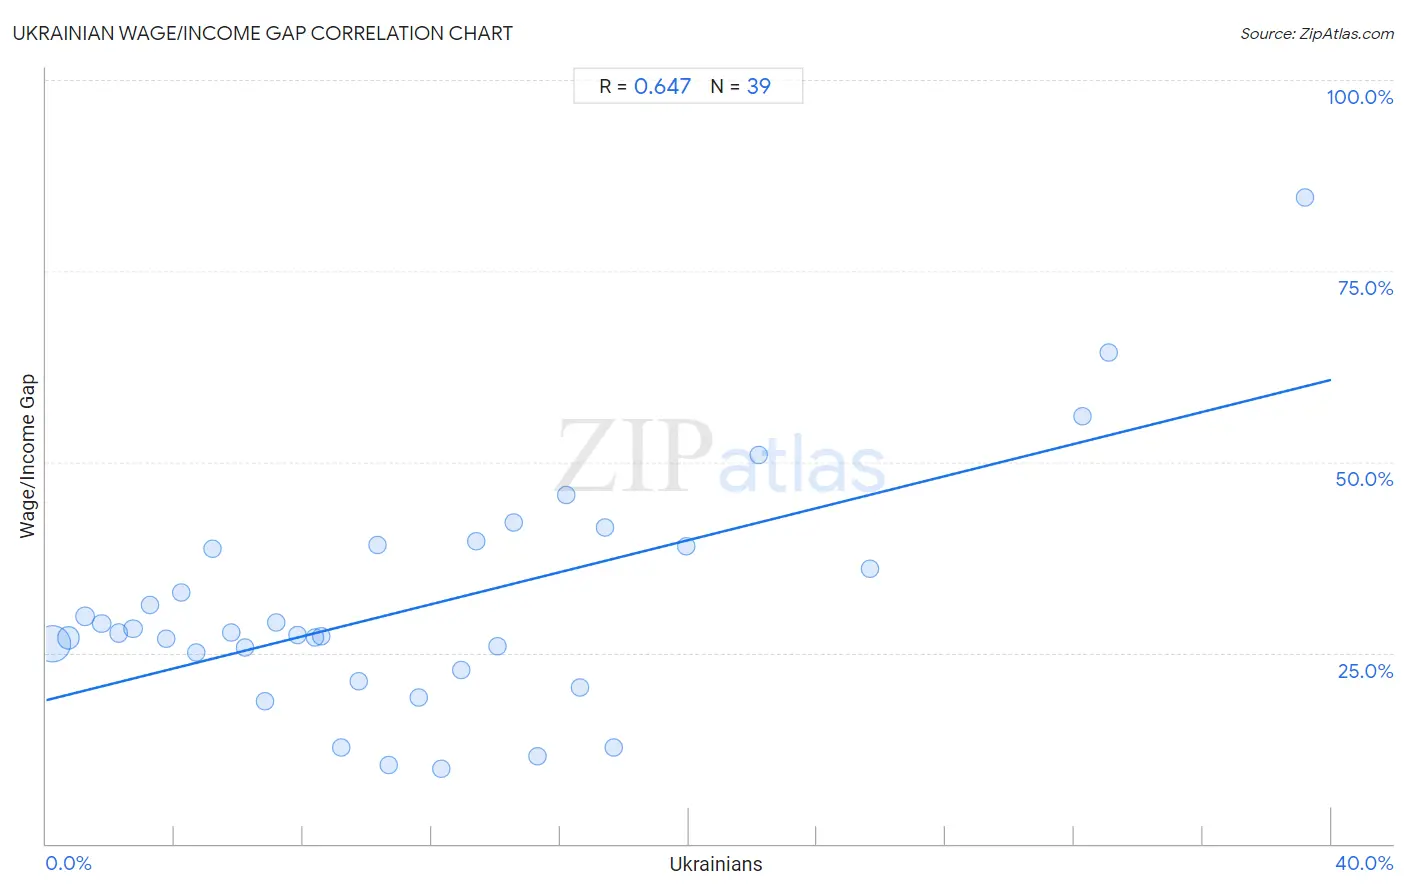
Ukrainian Wage/Income Gap Correlation Chart
The statistical analysis conducted on geographies consisting of 448,085,539 people shows a significant positive correlation between the proportion of Ukrainians and wage/income gap percentage in the United States with a correlation coefficient (R) of 0.647 and weighted average of 27.3%. On average, for every 1% (one percent) increase in Ukrainians within a typical geography, there is an increase of 1.0% in wage/income gap percentage.
It is essential to understand that the correlation between the percentage of Ukrainians and wage/income gap percentage does not imply a direct cause-and-effect relationship. It remains uncertain whether the presence of Ukrainians influences an upward or downward trend in the level of wage/income gap percentage within an area, or if Ukrainians simply ended up residing in those areas with higher or lower levels of wage/income gap percentage due to other factors.
Demographics Similar to Ukrainians by Wage/Income Gap
In terms of wage/income gap, the demographic groups most similar to Ukrainians are Immigrants from Norway (27.3%, a difference of 0.060%), Immigrants from Czechoslovakia (27.3%, a difference of 0.16%), Portuguese (27.4%, a difference of 0.16%), Carpatho Rusyn (27.3%, a difference of 0.18%), and Cypriot (27.3%, a difference of 0.19%).
| Demographics | Rating | Rank | Wage/Income Gap |
| Immigrants from the Azores | 3.5 /100 | #245 | Tragic 27.2% |
| Nonimmigrants | 3.3 /100 | #246 | Tragic 27.2% |
| Celtics | 2.8 /100 | #247 | Tragic 27.3% |
| Cypriots | 2.8 /100 | #248 | Tragic 27.3% |
| Carpatho Rusyns | 2.7 /100 | #249 | Tragic 27.3% |
| Immigrants from Czechoslovakia | 2.7 /100 | #250 | Tragic 27.3% |
| Immigrants from Norway | 2.5 /100 | #251 | Tragic 27.3% |
| Ukrainians | 2.4 /100 | #252 | Tragic 27.3% |
| Portuguese | 2.2 /100 | #253 | Tragic 27.4% |
| Israelis | 2.1 /100 | #254 | Tragic 27.4% |
| Immigrants from France | 2.1 /100 | #255 | Tragic 27.4% |
| Cherokee | 1.9 /100 | #256 | Tragic 27.4% |
| Luxembourgers | 1.9 /100 | #257 | Tragic 27.4% |
| Slavs | 1.8 /100 | #258 | Tragic 27.4% |
| Icelanders | 1.8 /100 | #259 | Tragic 27.5% |
Ukrainian Wage/Income Gap Correlation Summary
| Measurement | Ukrainian Data | Wage/Income Gap Data |
| Minimum | 0.19% | 9.8% |
| Maximum | 39.2% | 84.6% |
| Range | 39.0% | 74.9% |
| Mean | 11.7% | 31.0% |
| Median | 9.7% | 27.6% |
| Interquartile 25% (IQ1) | 4.7% | 22.7% |
| Interquartile 75% (IQ3) | 16.2% | 39.0% |
| Interquartile Range (IQR) | 11.5% | 16.3% |
| Standard Deviation (Sample) | 9.2% | 14.9% |
| Standard Deviation (Population) | 9.1% | 14.7% |
Correlation Details
| Ukrainian Percentile | Sample Size | Wage/Income Gap |
[ 0.0% - 0.5% ] 0.19% | 334,618,762 | 26.2% |
[ 0.5% - 1.0% ] 0.70% | 77,976,630 | 27.0% |
[ 1.0% - 1.5% ] 1.19% | 19,080,870 | 29.7% |
[ 1.5% - 2.0% ] 1.73% | 7,927,950 | 28.8% |
[ 2.0% - 2.5% ] 2.24% | 2,893,483 | 27.6% |
[ 2.5% - 3.0% ] 2.70% | 2,311,973 | 28.2% |
[ 3.0% - 3.5% ] 3.25% | 699,994 | 31.3% |
[ 3.5% - 4.0% ] 3.73% | 786,049 | 26.9% |
[ 4.0% - 4.5% ] 4.19% | 371,884 | 32.8% |
[ 4.5% - 5.0% ] 4.68% | 376,712 | 25.0% |
[ 5.0% - 5.5% ] 5.19% | 138,516 | 38.6% |
[ 5.5% - 6.0% ] 5.76% | 299,552 | 27.6% |
[ 6.0% - 6.5% ] 6.20% | 144,629 | 25.8% |
[ 6.5% - 7.0% ] 6.82% | 103,534 | 18.7% |
[ 7.0% - 7.5% ] 7.17% | 74,345 | 28.9% |
[ 7.5% - 8.0% ] 7.84% | 6,875 | 27.3% |
[ 8.0% - 8.5% ] 8.37% | 87,706 | 27.1% |
[ 8.5% - 9.0% ] 8.56% | 56,647 | 27.1% |
[ 9.0% - 9.5% ] 9.18% | 7,985 | 12.6% |
[ 9.5% - 10.0% ] 9.71% | 11,441 | 21.3% |
[ 10.0% - 10.5% ] 10.31% | 5,423 | 39.1% |
[ 10.5% - 11.0% ] 10.68% | 2,819 | 10.4% |
[ 11.5% - 12.0% ] 11.60% | 85,599 | 19.1% |
[ 12.0% - 12.5% ] 12.29% | 1,921 | 9.8% |
[ 12.5% - 13.0% ] 12.92% | 1,888 | 22.7% |
[ 13.0% - 13.5% ] 13.38% | 3,566 | 39.6% |
[ 14.0% - 14.5% ] 14.05% | 1,836 | 25.8% |
[ 14.5% - 15.0% ] 14.56% | 1,195 | 42.1% |
[ 15.0% - 15.5% ] 15.29% | 255 | 11.5% |
[ 16.0% - 16.5% ] 16.19% | 2,390 | 45.7% |
[ 16.5% - 17.0% ] 16.62% | 343 | 20.4% |
[ 17.0% - 17.5% ] 17.39% | 92 | 41.4% |
[ 17.5% - 18.0% ] 17.68% | 181 | 12.6% |
[ 19.5% - 20.0% ] 19.92% | 492 | 39.0% |
[ 22.0% - 22.5% ] 22.16% | 388 | 50.8% |
[ 25.5% - 26.0% ] 25.65% | 382 | 35.9% |
[ 32.0% - 32.5% ] 32.26% | 155 | 56.1% |
[ 33.0% - 33.5% ] 33.09% | 952 | 64.3% |
[ 39.0% - 39.5% ] 39.20% | 125 | 84.6% |