Sioux Wage/Income Gap
COMPARE
Sioux
Select to Compare
Wage/Income Gap
Sioux Wage/Income Gap
24.3%
WAGE/INCOME GAP
96.9/ 100
METRIC RATING
113th/ 347
METRIC RANK
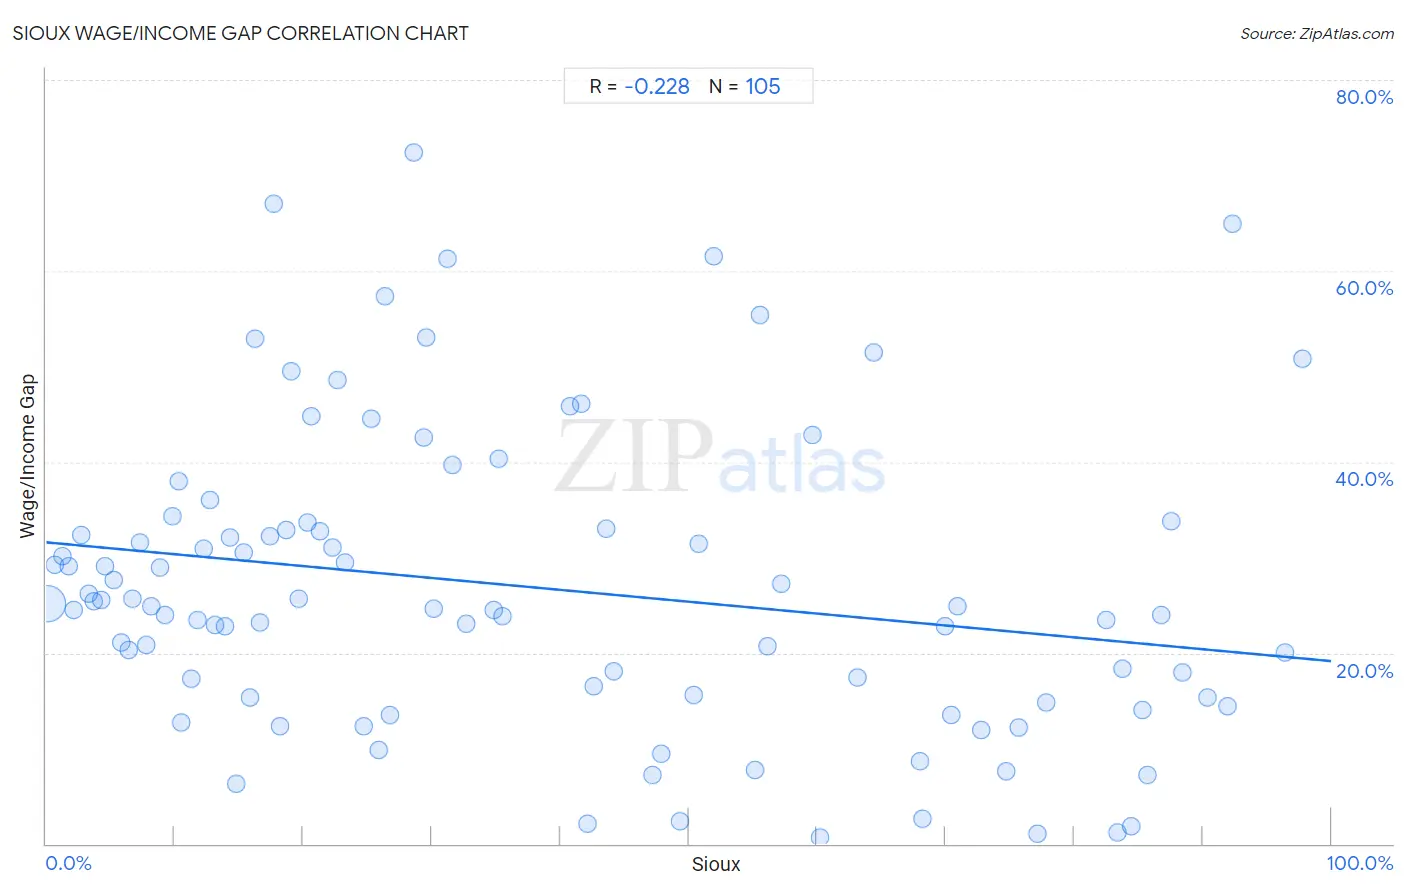
Sioux Wage/Income Gap Correlation Chart
The statistical analysis conducted on geographies consisting of 233,992,822 people shows a weak negative correlation between the proportion of Sioux and wage/income gap percentage in the United States with a correlation coefficient (R) of -0.228 and weighted average of 24.3%. On average, for every 1% (one percent) increase in Sioux within a typical geography, there is a decrease of 0.12% in wage/income gap percentage.
It is essential to understand that the correlation between the percentage of Sioux and wage/income gap percentage does not imply a direct cause-and-effect relationship. It remains uncertain whether the presence of Sioux influences an upward or downward trend in the level of wage/income gap percentage within an area, or if Sioux simply ended up residing in those areas with higher or lower levels of wage/income gap percentage due to other factors.
Demographics Similar to Sioux by Wage/Income Gap
In terms of wage/income gap, the demographic groups most similar to Sioux are Immigrants from Colombia (24.3%, a difference of 0.050%), Panamanian (24.4%, a difference of 0.20%), Immigrants from Kenya (24.4%, a difference of 0.26%), Alaska Native (24.4%, a difference of 0.43%), and Soviet Union (24.2%, a difference of 0.45%).
| Demographics | Rating | Rank | Wage/Income Gap |
| Sudanese | 98.6 /100 | #106 | Exceptional 24.0% |
| Yaqui | 98.4 /100 | #107 | Exceptional 24.0% |
| Immigrants from Albania | 98.4 /100 | #108 | Exceptional 24.0% |
| Ugandans | 98.3 /100 | #109 | Exceptional 24.1% |
| Immigrants from Morocco | 98.1 /100 | #110 | Exceptional 24.1% |
| Soviet Union | 97.6 /100 | #111 | Exceptional 24.2% |
| Immigrants from Colombia | 97.0 /100 | #112 | Exceptional 24.3% |
| Sioux | 96.9 /100 | #113 | Exceptional 24.3% |
| Panamanians | 96.5 /100 | #114 | Exceptional 24.4% |
| Immigrants from Kenya | 96.4 /100 | #115 | Exceptional 24.4% |
| Alaska Natives | 96.0 /100 | #116 | Exceptional 24.4% |
| Immigrants from Afghanistan | 95.9 /100 | #117 | Exceptional 24.4% |
| Immigrants from Micronesia | 95.8 /100 | #118 | Exceptional 24.4% |
| Kenyans | 95.8 /100 | #119 | Exceptional 24.5% |
| Cree | 95.6 /100 | #120 | Exceptional 24.5% |
Sioux Wage/Income Gap Correlation Summary
| Measurement | Sioux Data | Wage/Income Gap Data |
| Minimum | 0.069% | 0.72% |
| Maximum | 97.8% | 72.4% |
| Range | 97.7% | 71.7% |
| Mean | 37.7% | 26.9% |
| Median | 29.4% | 24.9% |
| Interquartile 25% (IQ1) | 12.9% | 15.3% |
| Interquartile 75% (IQ3) | 61.7% | 33.4% |
| Interquartile Range (IQR) | 48.7% | 18.1% |
| Standard Deviation (Sample) | 29.1% | 15.9% |
| Standard Deviation (Population) | 28.9% | 15.8% |
Correlation Details
| Sioux Percentile | Sample Size | Wage/Income Gap |
[ 0.0% - 0.5% ] 0.069% | 226,322,322 | 25.2% |
[ 0.5% - 1.0% ] 0.68% | 4,516,015 | 29.2% |
[ 1.0% - 1.5% ] 1.23% | 1,026,039 | 30.1% |
[ 1.5% - 2.0% ] 1.71% | 466,856 | 29.1% |
[ 2.0% - 2.5% ] 2.18% | 597,473 | 24.5% |
[ 2.5% - 3.0% ] 2.73% | 176,449 | 32.4% |
[ 3.0% - 3.5% ] 3.27% | 159,319 | 26.2% |
[ 3.5% - 4.0% ] 3.71% | 77,144 | 25.4% |
[ 4.0% - 4.5% ] 4.29% | 97,641 | 25.6% |
[ 4.5% - 5.0% ] 4.59% | 45,312 | 29.1% |
[ 5.0% - 5.5% ] 5.30% | 23,941 | 27.6% |
[ 5.5% - 6.0% ] 5.81% | 20,924 | 21.0% |
[ 6.0% - 6.5% ] 6.39% | 41,713 | 20.3% |
[ 6.5% - 7.0% ] 6.74% | 33,135 | 25.7% |
[ 7.0% - 7.5% ] 7.29% | 5,937 | 31.6% |
[ 7.5% - 8.0% ] 7.80% | 4,242 | 20.9% |
[ 8.0% - 8.5% ] 8.21% | 4,116 | 24.9% |
[ 8.5% - 9.0% ] 8.88% | 20,334 | 28.9% |
[ 9.0% - 9.5% ] 9.20% | 12,691 | 24.0% |
[ 9.5% - 10.0% ] 9.86% | 37,286 | 34.3% |
[ 10.0% - 10.5% ] 10.28% | 3,064 | 37.9% |
[ 10.5% - 11.0% ] 10.52% | 75,632 | 12.6% |
[ 11.0% - 11.5% ] 11.30% | 26,681 | 17.2% |
[ 11.5% - 12.0% ] 11.74% | 2,939 | 23.4% |
[ 12.0% - 12.5% ] 12.23% | 7,277 | 30.9% |
[ 12.5% - 13.0% ] 12.75% | 11,918 | 36.0% |
[ 13.0% - 13.5% ] 13.12% | 968 | 22.9% |
[ 13.5% - 14.0% ] 13.89% | 3,601 | 22.8% |
[ 14.0% - 14.5% ] 14.29% | 147 | 32.1% |
[ 14.5% - 15.0% ] 14.79% | 46,743 | 6.3% |
[ 15.0% - 15.5% ] 15.40% | 5,310 | 30.5% |
[ 15.5% - 16.0% ] 15.84% | 6,921 | 15.3% |
[ 16.0% - 16.5% ] 16.23% | 493 | 52.9% |
[ 16.5% - 17.0% ] 16.61% | 313 | 23.2% |
[ 17.0% - 17.5% ] 17.42% | 6,057 | 32.2% |
[ 17.5% - 18.0% ] 17.75% | 1,014 | 67.0% |
[ 18.0% - 18.5% ] 18.15% | 3,268 | 12.4% |
[ 18.5% - 19.0% ] 18.72% | 406 | 32.9% |
[ 19.0% - 19.5% ] 19.09% | 508 | 49.5% |
[ 19.5% - 20.0% ] 19.62% | 4,199 | 25.6% |
[ 20.0% - 20.5% ] 20.30% | 739 | 33.7% |
[ 20.5% - 21.0% ] 20.63% | 5,405 | 44.7% |
[ 21.0% - 21.5% ] 21.27% | 1,763 | 32.8% |
[ 22.0% - 22.5% ] 22.25% | 3,812 | 31.0% |
[ 22.5% - 23.0% ] 22.66% | 1,284 | 48.5% |
[ 23.0% - 23.5% ] 23.22% | 715 | 29.4% |
[ 24.5% - 25.0% ] 24.74% | 5,133 | 12.3% |
[ 25.0% - 25.5% ] 25.31% | 976 | 44.5% |
[ 25.5% - 26.0% ] 25.87% | 688 | 9.8% |
[ 26.0% - 26.5% ] 26.39% | 1,353 | 57.3% |
[ 26.5% - 27.0% ] 26.74% | 2,315 | 13.5% |
[ 28.5% - 29.0% ] 28.57% | 98 | 72.4% |
[ 29.0% - 29.5% ] 29.42% | 503 | 42.6% |
[ 29.5% - 30.0% ] 29.58% | 213 | 53.1% |
[ 30.0% - 30.5% ] 30.15% | 534 | 24.7% |
[ 31.0% - 31.5% ] 31.20% | 484 | 61.3% |
[ 31.5% - 32.0% ] 31.58% | 95 | 39.7% |
[ 32.5% - 33.0% ] 32.73% | 440 | 23.0% |
[ 34.5% - 35.0% ] 34.85% | 858 | 24.4% |
[ 35.0% - 35.5% ] 35.20% | 125 | 40.4% |
[ 35.5% - 36.0% ] 35.54% | 1,210 | 23.8% |
[ 40.5% - 41.0% ] 40.74% | 842 | 45.8% |
[ 41.5% - 42.0% ] 41.63% | 627 | 46.1% |
[ 42.0% - 42.5% ] 42.16% | 1,155 | 2.1% |
[ 42.5% - 43.0% ] 42.58% | 209 | 16.5% |
[ 43.5% - 44.0% ] 43.61% | 837 | 33.0% |
[ 44.0% - 44.5% ] 44.17% | 1,621 | 18.0% |
[ 47.0% - 47.5% ] 47.15% | 2,195 | 7.3% |
[ 47.5% - 48.0% ] 47.83% | 3,410 | 9.4% |
[ 49.0% - 49.5% ] 49.30% | 3,509 | 2.4% |
[ 50.0% - 50.5% ] 50.36% | 2,921 | 15.6% |
[ 50.5% - 51.0% ] 50.74% | 1,346 | 31.5% |
[ 51.5% - 52.0% ] 51.90% | 395 | 61.6% |
[ 55.0% - 55.5% ] 55.13% | 5,389 | 7.7% |
[ 55.5% - 56.0% ] 55.50% | 218 | 55.3% |
[ 56.0% - 56.5% ] 56.14% | 6,429 | 20.6% |
[ 57.0% - 57.5% ] 57.16% | 1,968 | 27.3% |
[ 59.5% - 60.0% ] 59.58% | 574 | 42.8% |
[ 60.0% - 60.5% ] 60.20% | 912 | 0.72% |
[ 63.0% - 63.5% ] 63.12% | 526 | 17.5% |
[ 64.0% - 64.5% ] 64.38% | 146 | 51.4% |
[ 67.5% - 68.0% ] 67.99% | 2,009 | 8.7% |
[ 68.0% - 68.5% ] 68.23% | 3,516 | 2.6% |
[ 69.5% - 70.0% ] 69.90% | 1,256 | 22.7% |
[ 70.0% - 70.5% ] 70.42% | 896 | 13.5% |
[ 70.5% - 71.0% ] 70.93% | 626 | 24.9% |
[ 72.5% - 73.0% ] 72.72% | 766 | 12.0% |
[ 74.5% - 75.0% ] 74.69% | 557 | 7.6% |
[ 75.5% - 76.0% ] 75.64% | 2,274 | 12.2% |
[ 77.0% - 77.5% ] 77.10% | 262 | 0.99% |
[ 77.5% - 78.0% ] 77.82% | 586 | 14.8% |
[ 82.0% - 82.5% ] 82.50% | 1,474 | 23.5% |
[ 83.0% - 83.5% ] 83.33% | 144 | 1.1% |
[ 83.5% - 84.0% ] 83.80% | 6,272 | 18.4% |
[ 84.0% - 84.5% ] 84.39% | 410 | 1.8% |
[ 85.0% - 85.5% ] 85.30% | 2,572 | 14.0% |
[ 85.5% - 86.0% ] 85.74% | 1,396 | 7.2% |
[ 86.5% - 87.0% ] 86.75% | 2,543 | 24.0% |
[ 87.0% - 87.5% ] 87.50% | 176 | 33.8% |
[ 88.0% - 88.5% ] 88.38% | 990 | 18.0% |
[ 90.0% - 90.5% ] 90.41% | 678 | 15.3% |
[ 91.5% - 92.0% ] 91.90% | 1,666 | 14.5% |
[ 92.0% - 92.5% ] 92.30% | 844 | 65.0% |
[ 96.0% - 96.5% ] 96.40% | 500 | 20.0% |
[ 97.5% - 98.0% ] 97.75% | 89 | 50.8% |