Alaskan Athabascan Wage/Income Gap

COMPARE

Alaskan Athabascan
Race
Ancestry
AfghanAfricanAlaska NativeAlaskan AthabascanAlbanianAleutAlsatianAmericanApacheArabArapahoArgentineanArmenianAssyrian/Chaldean/SyriacAustralianAustrianBahamianBangladeshiBarbadianBasqueBelgianBelizeanBermudanBhutaneseBlackfeetBolivianBrazilianBritishBritish West IndianBulgarianBurmeseCajunCambodianCanadianCape VerdeanCarpatho RusynCelticCentral AmericanCentral American IndianCherokeeCheyenneChickasawChileanChineseChippewaChoctawColombianColvilleComancheCosta RicanCreeCreekCroatianCrowCubanCypriotCzechCzechoslovakianDanishDelawareDominicanDutchDutch West IndianEastern EuropeanEcuadorianEgyptianEnglishEstonianEthiopianEuropeanFijianFilipinoFinnishFrenchFrench American IndianFrench CanadianGermanGerman RussianGhanaianGreekGuamanian/ChamorroGuatemalanGuyaneseHaitianHmongHonduranHopiHoumaHungarianIcelanderIndian (Asian)IndonesianInupiatIranianIraqiIrishIroquoisIsraeliItalianJamaicanJapaneseJordanianKenyanKiowaKoreanLaotianLatvianLebaneseLiberianLithuanianLumbeeLuxembourgerMacedonianMalaysianMalteseMarshalleseMenomineeMexicanMexican American IndianMongolianMoroccanNative HawaiianNavajoNepaleseNew ZealanderNicaraguanNigerianNorthern EuropeanNorwegianOkinawanOsageOttawaPaiutePakistaniPalestinianPanamanianParaguayanPennsylvania GermanPeruvianPimaPolishPortuguesePotawatomiPuebloPuerto RicanPuget Sound SalishRomanianRussianSalvadoranSamoanScandinavianScotch-IrishScottishSeminoleSenegaleseSerbianShoshoneSierra LeoneanSiouxSlavicSlovakSloveneSomaliSouth AfricanSouth AmericanSouth American IndianSoviet UnionSpaniardSpanishSpanish AmericanSpanish American IndianSri LankanSubsaharan AfricanSudaneseSwedishSwissSyrianTaiwaneseThaiTlingit-HaidaTohono O'OdhamTonganTrinidadian and TobagonianTsimshianTurkishU.S. Virgin IslanderUgandanUkrainianUruguayanUteVenezuelanVietnameseWelshWest IndianYakamaYaquiYugoslavianYumanYup'ikZimbabwean
Immigration
NonimmigrantsImmigrantsAfghanistanAfricaAlbaniaArgentinaArmeniaAsiaAustraliaAustriaBahamasBangladeshBarbadosBelarusBelgiumBelizeBoliviaBosnia and HerzegovinaBrazilBulgariaBurma/MyanmarCabo VerdeCambodiaCameroonCanadaCaribbeanCentral AmericaChileChinaColombiaCongoCosta RicaCroatiaCubaCzechoslovakiaDenmarkDominicaDominican RepublicEastern AfricaEastern AsiaEastern EuropeEcuadorEgyptEl SalvadorEnglandEritreaEthiopiaEuropeFijiFranceGermanyGhanaGreeceGrenadaGuatemalaGuyanaHaitiHondurasHong KongHungaryIndiaIndonesiaIranIraqIrelandIsraelItalyJamaicaJapanJordanKazakhstanKenyaKoreaKuwaitLaosLatin AmericaLatviaLebanonLiberiaLithuaniaMalaysiaMexicoMicronesiaMiddle AfricaMoldovaMoroccoNepalNetherlandsNicaraguaNigeriaNorth AmericaNorth MacedoniaNorthern AfricaNorthern EuropeNorwayOceaniaPakistanPanamaPeruPhilippinesPolandPortugalRomaniaRussiaSaudi ArabiaScotlandSenegalSerbiaSierra LeoneSingaporeSomaliaSouth AfricaSouth AmericaSouth Central AsiaSouth Eastern AsiaSouthern EuropeSpainSri LankaSt. Vincent and the GrenadinesSudanSwedenSwitzerlandSyriaTaiwanThailandTrinidad and TobagoTurkeyUgandaUkraineUruguayUzbekistanVenezuelaVietnamWest IndiesWestern AfricaWestern AsiaWestern EuropeYemenZaireZimbabweAzores
Select to Compare
Race
Ancestry
AfghanAfricanAlaska NativeAlbanianAleutAlsatianAmericanApacheArabArapahoArgentineanArmenianAssyrian/Chaldean/SyriacAustralianAustrianBahamianBangladeshiBarbadianBasqueBelgianBelizeanBermudanBhutaneseBlackfeetBolivianBrazilianBritishBritish West IndianBulgarianBurmeseCajunCambodianCanadianCape VerdeanCarpatho RusynCelticCentral AmericanCentral American IndianCherokeeCheyenneChickasawChileanChineseChippewaChoctawColombianColvilleComancheCosta RicanCreeCreekCroatianCrowCubanCypriotCzechCzechoslovakianDanishDelawareDominicanDutchDutch West IndianEastern EuropeanEcuadorianEgyptianEnglishEstonianEthiopianEuropeanFijianFilipinoFinnishFrenchFrench American IndianFrench CanadianGermanGerman RussianGhanaianGreekGuamanian/ChamorroGuatemalanGuyaneseHaitianHmongHonduranHopiHoumaHungarianIcelanderIndian (Asian)IndonesianInupiatIranianIraqiIrishIroquoisIsraeliItalianJamaicanJapaneseJordanianKenyanKiowaKoreanLaotianLatvianLebaneseLiberianLithuanianLumbeeLuxembourgerMacedonianMalaysianMalteseMarshalleseMenomineeMexicanMexican American IndianMongolianMoroccanNative HawaiianNavajoNepaleseNew ZealanderNicaraguanNigerianNorthern EuropeanNorwegianOkinawanOsageOttawaPaiutePakistaniPalestinianPanamanianParaguayanPennsylvania GermanPeruvianPimaPolishPortuguesePotawatomiPuebloPuerto RicanPuget Sound SalishRomanianRussianSalvadoranSamoanScandinavianScotch-IrishScottishSeminoleSenegaleseSerbianShoshoneSierra LeoneanSiouxSlavicSlovakSloveneSomaliSouth AfricanSouth AmericanSouth American IndianSoviet UnionSpaniardSpanishSpanish AmericanSpanish American IndianSri LankanSubsaharan AfricanSudaneseSwedishSwissSyrianTaiwaneseThaiTlingit-HaidaTohono O'OdhamTonganTrinidadian and TobagonianTsimshianTurkishU.S. Virgin IslanderUgandanUkrainianUruguayanUteVenezuelanVietnameseWelshWest IndianYakamaYaquiYugoslavianYumanYup'ikZimbabwean
Immigration
NonimmigrantsImmigrantsAfghanistanAfricaAlbaniaArgentinaArmeniaAsiaAustraliaAustriaBahamasBangladeshBarbadosBelarusBelgiumBelizeBoliviaBosnia and HerzegovinaBrazilBulgariaBurma/MyanmarCabo VerdeCambodiaCameroonCanadaCaribbeanCentral AmericaChileChinaColombiaCongoCosta RicaCroatiaCubaCzechoslovakiaDenmarkDominicaDominican RepublicEastern AfricaEastern AsiaEastern EuropeEcuadorEgyptEl SalvadorEnglandEritreaEthiopiaEuropeFijiFranceGermanyGhanaGreeceGrenadaGuatemalaGuyanaHaitiHondurasHong KongHungaryIndiaIndonesiaIranIraqIrelandIsraelItalyJamaicaJapanJordanKazakhstanKenyaKoreaKuwaitLaosLatin AmericaLatviaLebanonLiberiaLithuaniaMalaysiaMexicoMicronesiaMiddle AfricaMoldovaMoroccoNepalNetherlandsNicaraguaNigeriaNorth AmericaNorth MacedoniaNorthern AfricaNorthern EuropeNorwayOceaniaPakistanPanamaPeruPhilippinesPolandPortugalRomaniaRussiaSaudi ArabiaScotlandSenegalSerbiaSierra LeoneSingaporeSomaliaSouth AfricaSouth AmericaSouth Central AsiaSouth Eastern AsiaSouthern EuropeSpainSri LankaSt. Vincent and the GrenadinesSudanSwedenSwitzerlandSyriaTaiwanThailandTrinidad and TobagoTurkeyUgandaUkraineUruguayUzbekistanVenezuelaVietnamWest IndiesWestern AfricaWestern AsiaWestern EuropeYemenZaireZimbabweAzores
Wage/Income Gap
Income
Poverty
Unemployment
Labor Participation
Family Structure
Vehicle Availability
Education Level
Disability

Alaskan Athabascan Wage/Income Gap
Average

25.8%
WAGE/INCOME GAP
50.0/ 100
METRIC RATING
174th/ 347
METRIC RANK

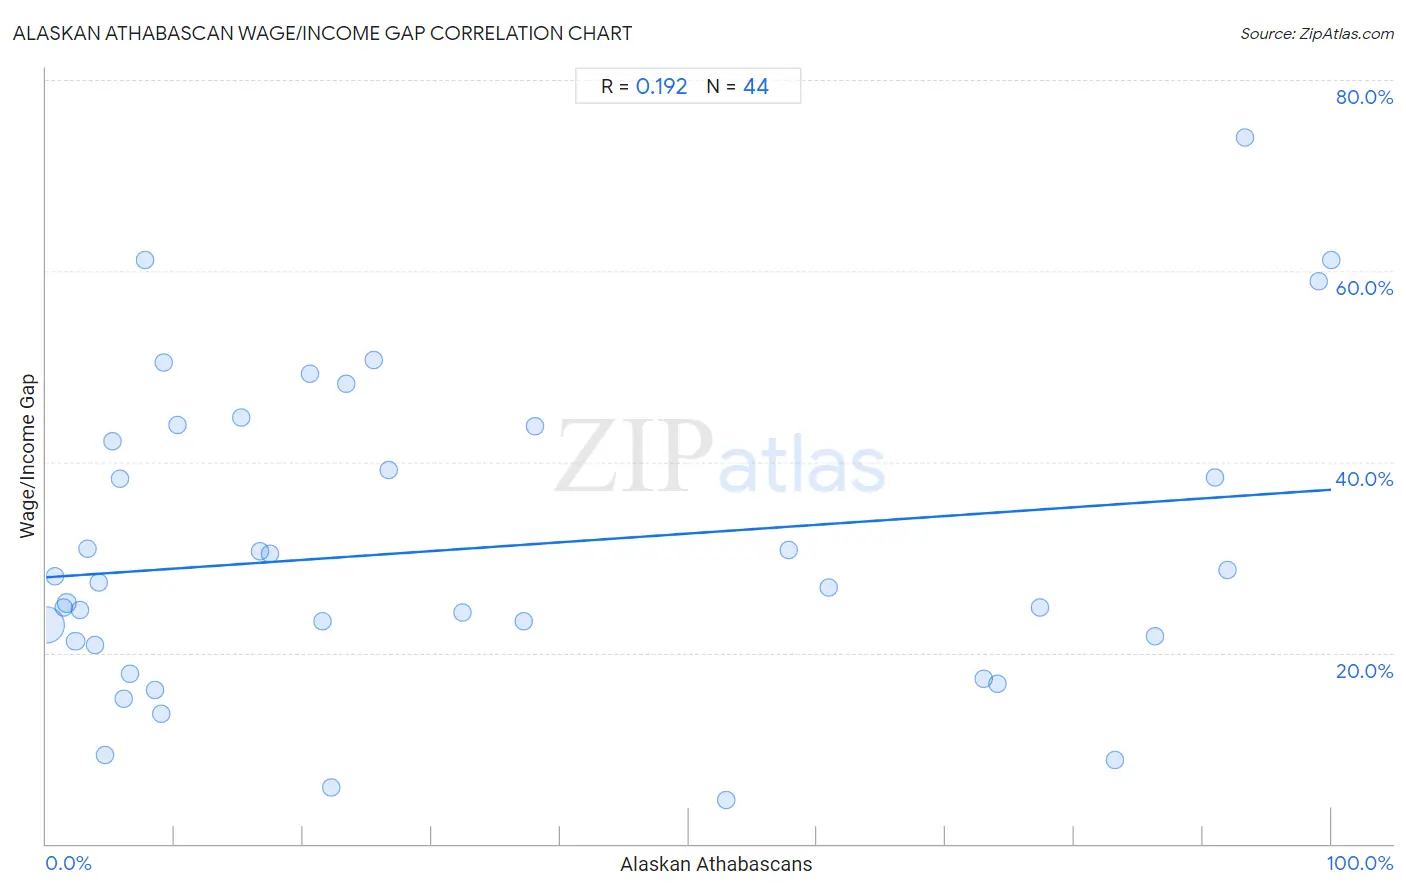
Alaskan Athabascan Wage/Income Gap Correlation Chart

The statistical analysis conducted on geographies consisting of 45,785,109 people shows a poor positive correlation between the proportion of Alaskan Athabascans and wage/income gap percentage in the United States with a correlation coefficient (R) of 0.192 and weighted average of 25.8%. On average, for every 1% (one percent) increase in Alaskan Athabascans within a typical geography, there is an increase of 0.092% in wage/income gap percentage.
Alaskan Athabascan Wage/Income Gap
It is essential to understand that the correlation between the percentage of Alaskan Athabascans and wage/income gap percentage does not imply a direct cause-and-effect relationship. It remains uncertain whether the presence of Alaskan Athabascans influences an upward or downward trend in the level of wage/income gap percentage within an area, or if Alaskan Athabascans simply ended up residing in those areas with higher or lower levels of wage/income gap percentage due to other factors.

Demographics Similar to Alaskan Athabascans by Wage/Income Gap

In terms of wage/income gap, the demographic groups most similar to Alaskan Athabascans are Immigrants from Belarus (25.7%, a difference of 0.19%), Sri Lankan (25.8%, a difference of 0.20%), Immigrants from Chile (25.7%, a difference of 0.21%), Paraguayan (25.8%, a difference of 0.21%), and Cambodian (25.8%, a difference of 0.32%).
DemographicsRating | RankWage/Income Gap
Paiute
62.9
/100
|
#167
Good
25.5%
Seminole
62.6
/100
|
#168
Good
25.6%
Peruvians
60.1
/100
|
#169
Good
25.6%
Immigrants from Oceania
57.5
/100
|
#170
Average
25.6%
Immigrants from Greece
56.6
/100
|
#171
Average
25.7%
Immigrants from Chile
53.2
/100
|
#172
Average
25.7%
Immigrants from Belarus
52.9
/100
|
#173
Average
25.7%
Alaskan Athabascans
50.0
/100
|
#174
Average
25.8%
Sri Lankans
47.0
/100
|
#175
Average
25.8%
Paraguayans
46.7
/100
|
#176
Average
25.8%
Cambodians
45.1
/100
|
#177
Average
25.8%
Chinese
42.0
/100
|
#178
Average
25.9%
Samoans
38.6
/100
|
#179
Fair
26.0%
Guamanians/Chamorros
38.0
/100
|
#180
Fair
26.0%
Immigrants from Bolivia
36.4
/100
|
#181
Fair
26.0%

Alaskan Athabascan Wage/Income Gap Correlation Summary

MeasurementAlaskan Athabascan DataWage/Income Gap Data
Minimum0.025%4.5%
Maximum100.0%74.0%
Range100.0%69.5%
Mean32.5%30.9%
Median19.0%27.1%
Interquartile 25% (IQ1)5.5%21.0%
Interquartile 75% (IQ3)59.3%42.9%
Interquartile Range (IQR)53.8%21.9%
Standard Deviation (Sample)33.5%16.0%
Standard Deviation (Population)33.2%15.8%

Correlation Details

Alaskan Athabascan PercentileSample SizeWage/Income Gap
[
0.0%
-
0.5%
]
0.025%
44,538,78122.9%
[
0.5%
-
1.0%
]
0.67%
228,07328.0%
[
1.0%
-
1.5%
]
1.34%
113,25424.7%
[
1.5%
-
2.0%
]
1.59%
513,92225.2%
[
2.0%
-
2.5%
]
2.29%
150,88521.2%
[
2.5%
-
3.0%
]
2.63%
13,68624.5%
[
3.0%
-
3.5%
]
3.20%
72,29330.9%
[
3.5%
-
4.0%
]
3.80%
5,73020.8%
[
4.0%
-
4.5%
]
4.08%
17,48027.4%
[
4.5%
-
5.0%
]
4.61%
2,0619.4%
[
5.0%
-
5.5%
]
5.20%
28,34342.1%
[
5.5%
-
6.0%
]
5.76%
20,60438.3%
[
6.0%
-
6.5%
]
6.07%
1,17015.2%
[
6.5%
-
7.0%
]
6.56%
33,21117.8%
[
7.5%
-
8.0%
]
7.65%
40561.2%
[
8.0%
-
8.5%
]
8.49%
5,32116.1%
[
8.5%
-
9.0%
]
8.98%
18,29513.6%
[
9.0%
-
9.5%
]
9.13%
96450.4%
[
10.0%
-
10.5%
]
10.26%
6,54243.9%
[
15.0%
-
15.5%
]
15.22%
9244.7%
[
16.5%
-
17.0%
]
16.60%
23530.6%
[
17.0%
-
17.5%
]
17.38%
1,92730.4%
[
20.5%
-
21.0%
]
20.57%
1,16749.3%
[
21.0%
-
21.5%
]
21.47%
84323.3%
[
22.0%
-
22.5%
]
22.16%
3795.8%
[
23.0%
-
23.5%
]
23.37%
52248.1%
[
25.0%
-
25.5%
]
25.49%
76150.7%
[
26.5%
-
27.0%
]
26.65%
43939.2%
[
32.0%
-
32.5%
]
32.34%
1,71924.2%
[
37.0%
-
37.5%
]
37.20%
50823.3%
[
38.0%
-
38.5%
]
38.05%
45243.7%
[
52.5%
-
53.0%
]
52.89%
3294.5%
[
57.5%
-
58.0%
]
57.74%
1,25430.7%
[
60.5%
-
61.0%
]
60.87%
6926.9%
[
72.5%
-
73.0%
]
72.99%
27417.3%
[
74.0%
-
74.5%
]
74.07%
27016.7%
[
77.0%
-
77.5%
]
77.31%
95224.7%
[
83.0%
-
83.5%
]
83.18%
4288.8%
[
86.0%
-
86.5%
]
86.26%
36421.7%
[
90.5%
-
91.0%
]
90.95%
39838.4%
[
91.5%
-
92.0%
]
91.95%
17428.7%
[
93.0%
-
93.5%
]
93.24%
14874.0%
[
99.0%
-
99.5%
]
99.00%
20158.9%
[
99.5%
-
100.0%
]
100.00%
18461.1%