Immigrants from Romania Wage/Income Gap

COMPARE

Immigrants from Romania
Race
Ancestry
AfghanAfricanAlaska NativeAlaskan AthabascanAlbanianAleutAlsatianAmericanApacheArabArapahoArgentineanArmenianAssyrian/Chaldean/SyriacAustralianAustrianBahamianBangladeshiBarbadianBasqueBelgianBelizeanBermudanBhutaneseBlackfeetBolivianBrazilianBritishBritish West IndianBulgarianBurmeseCajunCambodianCanadianCape VerdeanCarpatho RusynCelticCentral AmericanCentral American IndianCherokeeCheyenneChickasawChileanChineseChippewaChoctawColombianColvilleComancheCosta RicanCreeCreekCroatianCrowCubanCypriotCzechCzechoslovakianDanishDelawareDominicanDutchDutch West IndianEastern EuropeanEcuadorianEgyptianEnglishEstonianEthiopianEuropeanFijianFilipinoFinnishFrenchFrench American IndianFrench CanadianGermanGerman RussianGhanaianGreekGuamanian/ChamorroGuatemalanGuyaneseHaitianHmongHonduranHopiHoumaHungarianIcelanderIndian (Asian)IndonesianInupiatIranianIraqiIrishIroquoisIsraeliItalianJamaicanJapaneseJordanianKenyanKiowaKoreanLaotianLatvianLebaneseLiberianLithuanianLumbeeLuxembourgerMacedonianMalaysianMalteseMarshalleseMenomineeMexicanMexican American IndianMongolianMoroccanNative HawaiianNavajoNepaleseNew ZealanderNicaraguanNigerianNorthern EuropeanNorwegianOkinawanOsageOttawaPaiutePakistaniPalestinianPanamanianParaguayanPennsylvania GermanPeruvianPimaPolishPortuguesePotawatomiPuebloPuerto RicanPuget Sound SalishRomanianRussianSalvadoranSamoanScandinavianScotch-IrishScottishSeminoleSenegaleseSerbianShoshoneSierra LeoneanSiouxSlavicSlovakSloveneSomaliSouth AfricanSouth AmericanSouth American IndianSoviet UnionSpaniardSpanishSpanish AmericanSpanish American IndianSri LankanSubsaharan AfricanSudaneseSwedishSwissSyrianTaiwaneseThaiTlingit-HaidaTohono O'OdhamTonganTrinidadian and TobagonianTsimshianTurkishU.S. Virgin IslanderUgandanUkrainianUruguayanUteVenezuelanVietnameseWelshWest IndianYakamaYaquiYugoslavianYumanYup'ikZimbabwean
Immigration
NonimmigrantsImmigrantsAfghanistanAfricaAlbaniaArgentinaArmeniaAsiaAustraliaAustriaBahamasBangladeshBarbadosBelarusBelgiumBelizeBoliviaBosnia and HerzegovinaBrazilBulgariaBurma/MyanmarCabo VerdeCambodiaCameroonCanadaCaribbeanCentral AmericaChileChinaColombiaCongoCosta RicaCroatiaCubaCzechoslovakiaDenmarkDominicaDominican RepublicEastern AfricaEastern AsiaEastern EuropeEcuadorEgyptEl SalvadorEnglandEritreaEthiopiaEuropeFijiFranceGermanyGhanaGreeceGrenadaGuatemalaGuyanaHaitiHondurasHong KongHungaryIndiaIndonesiaIranIraqIrelandIsraelItalyJamaicaJapanJordanKazakhstanKenyaKoreaKuwaitLaosLatin AmericaLatviaLebanonLiberiaLithuaniaMalaysiaMexicoMicronesiaMiddle AfricaMoldovaMoroccoNepalNetherlandsNicaraguaNigeriaNorth AmericaNorth MacedoniaNorthern AfricaNorthern EuropeNorwayOceaniaPakistanPanamaPeruPhilippinesPolandPortugalRomaniaRussiaSaudi ArabiaScotlandSenegalSerbiaSierra LeoneSingaporeSomaliaSouth AfricaSouth AmericaSouth Central AsiaSouth Eastern AsiaSouthern EuropeSpainSri LankaSt. Vincent and the GrenadinesSudanSwedenSwitzerlandSyriaTaiwanThailandTrinidad and TobagoTurkeyUgandaUkraineUruguayUzbekistanVenezuelaVietnamWest IndiesWestern AfricaWestern AsiaWestern EuropeYemenZaireZimbabweAzores
Select to Compare
Race
Ancestry
AfghanAfricanAlaska NativeAlaskan AthabascanAlbanianAleutAlsatianAmericanApacheArabArapahoArgentineanArmenianAssyrian/Chaldean/SyriacAustralianAustrianBahamianBangladeshiBarbadianBasqueBelgianBelizeanBermudanBhutaneseBlackfeetBolivianBrazilianBritishBritish West IndianBulgarianBurmeseCajunCambodianCanadianCape VerdeanCarpatho RusynCelticCentral AmericanCentral American IndianCherokeeCheyenneChickasawChileanChineseChippewaChoctawColombianColvilleComancheCosta RicanCreeCreekCroatianCrowCubanCypriotCzechCzechoslovakianDanishDelawareDominicanDutchDutch West IndianEastern EuropeanEcuadorianEgyptianEnglishEstonianEthiopianEuropeanFijianFilipinoFinnishFrenchFrench American IndianFrench CanadianGermanGerman RussianGhanaianGreekGuamanian/ChamorroGuatemalanGuyaneseHaitianHmongHonduranHopiHoumaHungarianIcelanderIndian (Asian)IndonesianInupiatIranianIraqiIrishIroquoisIsraeliItalianJamaicanJapaneseJordanianKenyanKiowaKoreanLaotianLatvianLebaneseLiberianLithuanianLumbeeLuxembourgerMacedonianMalaysianMalteseMarshalleseMenomineeMexicanMexican American IndianMongolianMoroccanNative HawaiianNavajoNepaleseNew ZealanderNicaraguanNigerianNorthern EuropeanNorwegianOkinawanOsageOttawaPaiutePakistaniPalestinianPanamanianParaguayanPennsylvania GermanPeruvianPimaPolishPortuguesePotawatomiPuebloPuerto RicanPuget Sound SalishRomanianRussianSalvadoranSamoanScandinavianScotch-IrishScottishSeminoleSenegaleseSerbianShoshoneSierra LeoneanSiouxSlavicSlovakSloveneSomaliSouth AfricanSouth AmericanSouth American IndianSoviet UnionSpaniardSpanishSpanish AmericanSpanish American IndianSri LankanSubsaharan AfricanSudaneseSwedishSwissSyrianTaiwaneseThaiTlingit-HaidaTohono O'OdhamTonganTrinidadian and TobagonianTsimshianTurkishU.S. Virgin IslanderUgandanUkrainianUruguayanUteVenezuelanVietnameseWelshWest IndianYakamaYaquiYugoslavianYumanYup'ikZimbabwean
Immigration
NonimmigrantsImmigrantsAfghanistanAfricaAlbaniaArgentinaArmeniaAsiaAustraliaAustriaBahamasBangladeshBarbadosBelarusBelgiumBelizeBoliviaBosnia and HerzegovinaBrazilBulgariaBurma/MyanmarCabo VerdeCambodiaCameroonCanadaCaribbeanCentral AmericaChileChinaColombiaCongoCosta RicaCroatiaCubaCzechoslovakiaDenmarkDominicaDominican RepublicEastern AfricaEastern AsiaEastern EuropeEcuadorEgyptEl SalvadorEnglandEritreaEthiopiaEuropeFijiFranceGermanyGhanaGreeceGrenadaGuatemalaGuyanaHaitiHondurasHong KongHungaryIndiaIndonesiaIranIraqIrelandIsraelItalyJamaicaJapanJordanKazakhstanKenyaKoreaKuwaitLaosLatin AmericaLatviaLebanonLiberiaLithuaniaMalaysiaMexicoMicronesiaMiddle AfricaMoldovaMoroccoNepalNetherlandsNicaraguaNigeriaNorth AmericaNorth MacedoniaNorthern AfricaNorthern EuropeNorwayOceaniaPakistanPanamaPeruPhilippinesPolandPortugalRussiaSaudi ArabiaScotlandSenegalSerbiaSierra LeoneSingaporeSomaliaSouth AfricaSouth AmericaSouth Central AsiaSouth Eastern AsiaSouthern EuropeSpainSri LankaSt. Vincent and the GrenadinesSudanSwedenSwitzerlandSyriaTaiwanThailandTrinidad and TobagoTurkeyUgandaUkraineUruguayUzbekistanVenezuelaVietnamWest IndiesWestern AfricaWestern AsiaWestern EuropeYemenZaireZimbabweAzores
Wage/Income Gap
Income
Poverty
Unemployment
Labor Participation
Family Structure
Vehicle Availability
Education Level
Disability

Immigrants from Romania Wage/Income Gap
Tragic

27.0%
WAGE/INCOME GAP
4.8/ 100
METRIC RATING
236th/ 347
METRIC RANK

Immigrants from Romania Wage/Income Gap Correlation Chart

The statistical analysis conducted on geographies consisting of 256,953,227 people shows a slight negative correlation between the proportion of Immigrants from Romania and wage/income gap percentage in the United States with a correlation coefficient (R) of -0.082 and weighted average of 27.0%. On average, for every 1% (one percent) increase in Immigrants from Romania within a typical geography, there is a decrease of 0.36% in wage/income gap percentage.
Immigrants from Romania Wage/Income Gap
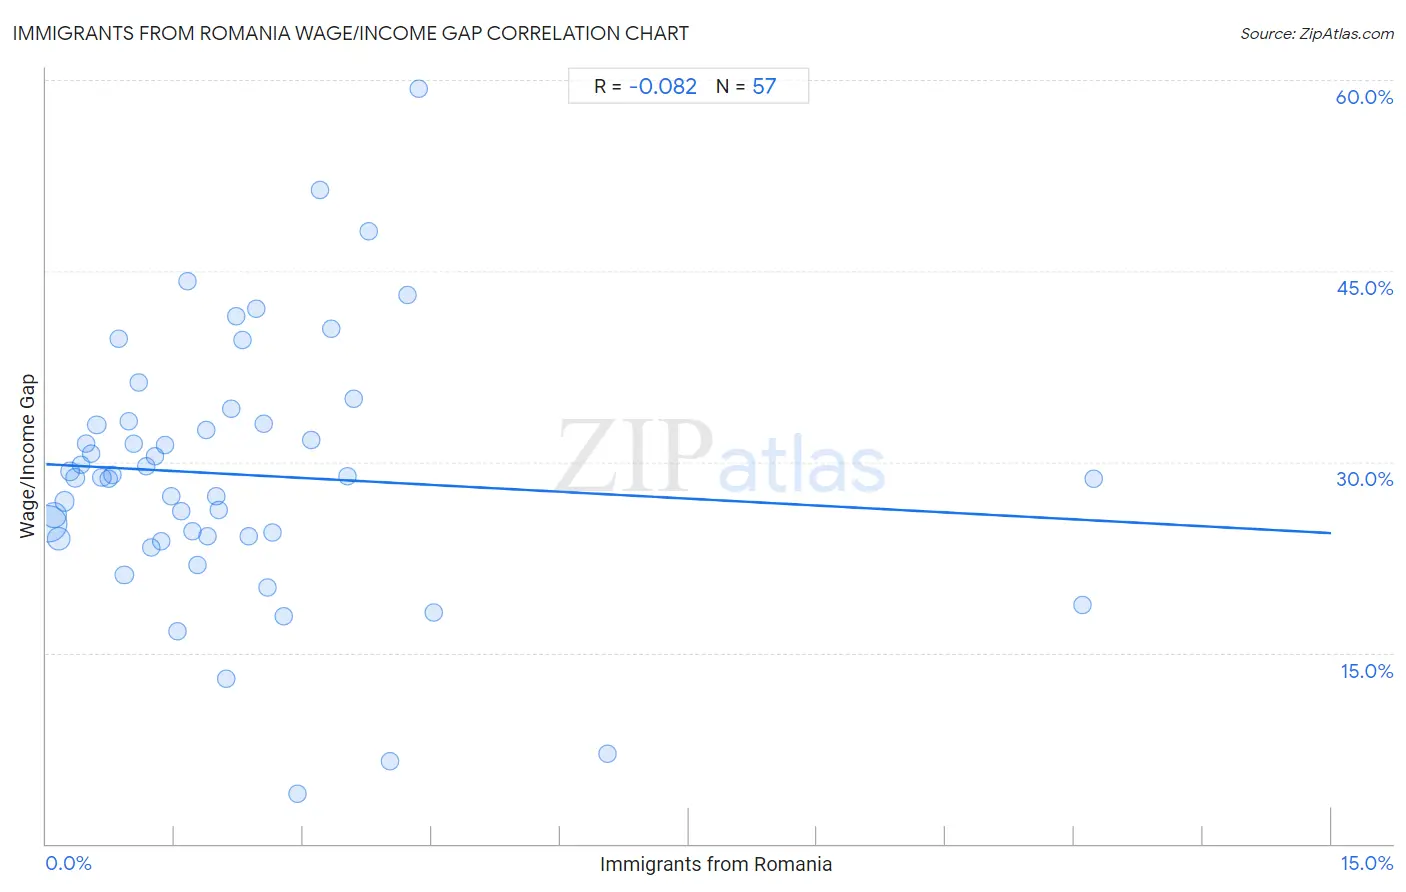
It is essential to understand that the correlation between the percentage of Immigrants from Romania and wage/income gap percentage does not imply a direct cause-and-effect relationship. It remains uncertain whether the presence of Immigrants from Romania influences an upward or downward trend in the level of wage/income gap percentage within an area, or if Immigrants from Romania simply ended up residing in those areas with higher or lower levels of wage/income gap percentage due to other factors.

Demographics Similar to Immigrants from Romania by Wage/Income Gap

In terms of wage/income gap, the demographic groups most similar to Immigrants from Romania are Immigrants from Hungary (27.0%, a difference of 0.020%), Immigrants from Pakistan (27.0%, a difference of 0.030%), Immigrants from Brazil (27.0%, a difference of 0.080%), Argentinean (27.0%, a difference of 0.14%), and Immigrants from Eastern Asia (27.1%, a difference of 0.15%).
DemographicsRating | RankWage/Income Gap
Immigrants from Asia
5.5
/100
|
#229
Tragic
27.0%
Ottawa
5.3
/100
|
#230
Tragic
27.0%
Bhutanese
5.3
/100
|
#231
Tragic
27.0%
Argentineans
5.2
/100
|
#232
Tragic
27.0%
Immigrants from Brazil
5.0
/100
|
#233
Tragic
27.0%
Immigrants from Pakistan
4.9
/100
|
#234
Tragic
27.0%
Immigrants from Hungary
4.8
/100
|
#235
Tragic
27.0%
Immigrants from Romania
4.8
/100
|
#236
Tragic
27.0%
Immigrants from Eastern Asia
4.4
/100
|
#237
Tragic
27.1%
Osage
4.4
/100
|
#238
Tragic
27.1%
Estonians
4.3
/100
|
#239
Tragic
27.1%
Immigrants from Europe
3.8
/100
|
#240
Tragic
27.1%
Creek
3.8
/100
|
#241
Tragic
27.1%
Immigrants from Sri Lanka
3.7
/100
|
#242
Tragic
27.1%
Spanish
3.6
/100
|
#243
Tragic
27.1%

Immigrants from Romania Wage/Income Gap Correlation Summary

MeasurementImmigrants from Romania DataWage/Income Gap Data
Minimum0.030%4.0%
Maximum12.2%59.4%
Range12.2%55.4%
Mean2.3%29.0%
Median1.8%28.8%
Interquartile 25% (IQ1)0.88%24.1%
Interquartile 75% (IQ3)2.9%33.1%
Interquartile Range (IQR)2.0%9.0%
Standard Deviation (Sample)2.3%10.3%
Standard Deviation (Population)2.3%10.2%

Correlation Details

Immigrants from Romania PercentileSample SizeWage/Income Gap
[
0.0%
-
0.5%
]
0.030%
129,813,15425.1%
[
0.0%
-
0.5%
]
0.089%
50,827,95625.8%
[
0.0%
-
0.5%
]
0.15%
35,113,31624.0%
[
0.0%
-
0.5%
]
0.21%
15,178,10126.9%
[
0.0%
-
0.5%
]
0.28%
7,232,14929.3%
[
0.0%
-
0.5%
]
0.34%
5,116,42028.7%
[
0.0%
-
0.5%
]
0.40%
3,618,70629.8%
[
0.0%
-
0.5%
]
0.46%
2,240,18531.5%
[
0.5%
-
1.0%
]
0.52%
1,757,64530.7%
[
0.5%
-
1.0%
]
0.59%
1,531,22632.9%
[
0.5%
-
1.0%
]
0.65%
766,64528.8%
[
0.5%
-
1.0%
]
0.72%
620,78528.6%
[
0.5%
-
1.0%
]
0.78%
688,49429.0%
[
0.5%
-
1.0%
]
0.85%
293,06439.6%
[
0.5%
-
1.0%
]
0.91%
523,52221.1%
[
0.5%
-
1.0%
]
0.97%
273,19833.2%
[
1.0%
-
1.5%
]
1.03%
114,75431.4%
[
1.0%
-
1.5%
]
1.09%
132,56736.3%
[
1.0%
-
1.5%
]
1.17%
77,80629.7%
[
1.0%
-
1.5%
]
1.23%
189,44123.3%
[
1.0%
-
1.5%
]
1.27%
50,76730.5%
[
1.0%
-
1.5%
]
1.34%
180,52623.8%
[
1.0%
-
1.5%
]
1.39%
52,82531.4%
[
1.0%
-
1.5%
]
1.46%
54,25027.3%
[
1.5%
-
2.0%
]
1.54%
36,54216.7%
[
1.5%
-
2.0%
]
1.57%
6,66726.1%
[
1.5%
-
2.0%
]
1.65%
12,05044.2%
[
1.5%
-
2.0%
]
1.70%
6,16924.6%
[
1.5%
-
2.0%
]
1.76%
65,33421.9%
[
1.5%
-
2.0%
]
1.87%
4,39232.5%
[
1.5%
-
2.0%
]
1.89%
93,71324.1%
[
1.5%
-
2.0%
]
1.98%
61,13627.3%
[
2.0%
-
2.5%
]
2.02%
64,67126.2%
[
2.0%
-
2.5%
]
2.10%
11,05612.9%
[
2.0%
-
2.5%
]
2.15%
41,13434.2%
[
2.0%
-
2.5%
]
2.21%
11,06241.4%
[
2.0%
-
2.5%
]
2.29%
52339.6%
[
2.0%
-
2.5%
]
2.37%
2,02724.1%
[
2.0%
-
2.5%
]
2.46%
27,37842.0%
[
2.5%
-
3.0%
]
2.53%
12,34833.0%
[
2.5%
-
3.0%
]
2.58%
1,12520.1%
[
2.5%
-
3.0%
]
2.65%
1,81424.5%
[
2.5%
-
3.0%
]
2.77%
1,04817.9%
[
2.5%
-
3.0%
]
2.94%
26,9394.0%
[
3.0%
-
3.5%
]
3.10%
1,19431.7%
[
3.0%
-
3.5%
]
3.19%
90951.4%
[
3.0%
-
3.5%
]
3.32%
1,80740.5%
[
3.5%
-
4.0%
]
3.52%
42628.8%
[
3.5%
-
4.0%
]
3.59%
39035.0%
[
3.5%
-
4.0%
]
3.77%
2,81248.1%
[
4.0%
-
4.5%
]
4.01%
6736.5%
[
4.0%
-
4.5%
]
4.21%
5,55543.1%
[
4.0%
-
4.5%
]
4.35%
6959.4%
[
4.5%
-
5.0%
]
4.52%
79718.1%
[
6.5%
-
7.0%
]
6.55%
4127.1%
[
12.0%
-
12.5%
]
12.10%
1,88518.8%
[
12.0%
-
12.5%
]
12.23%
1,66828.7%