Immigrants from Caribbean Wage/Income Gap
COMPARE
Immigrants from Caribbean
Select to Compare
Wage/Income Gap
Immigrants from Caribbean Wage/Income Gap
20.4%
WAGE/INCOME GAP
100.0/ 100
METRIC RATING
21st/ 347
METRIC RANK
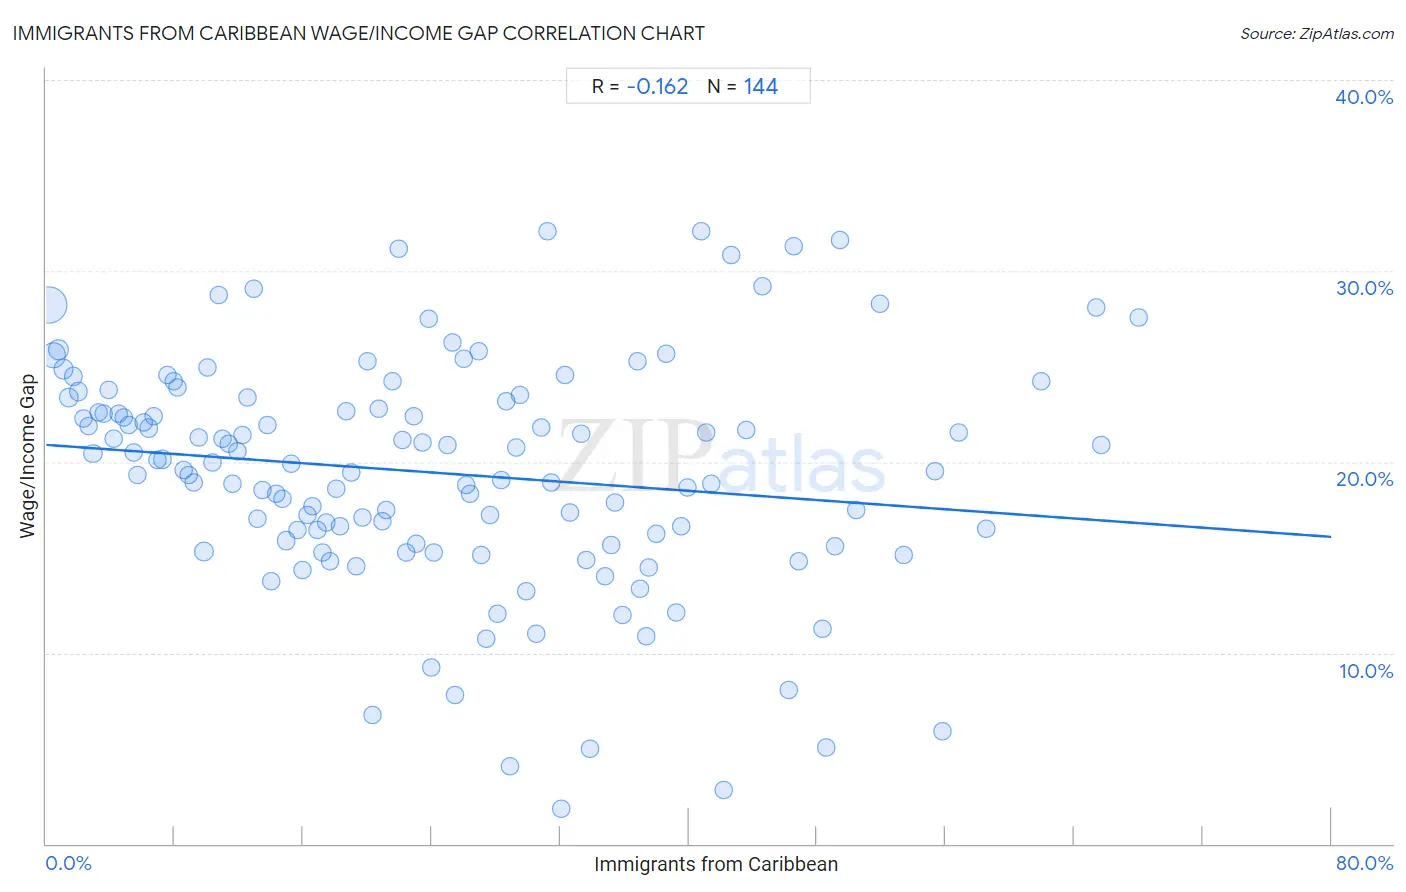
Immigrants from Caribbean Wage/Income Gap Correlation Chart
The statistical analysis conducted on geographies consisting of 449,503,192 people shows a poor negative correlation between the proportion of Immigrants from Caribbean and wage/income gap percentage in the United States with a correlation coefficient (R) of -0.162 and weighted average of 20.4%. On average, for every 1% (one percent) increase in Immigrants from Caribbean within a typical geography, there is a decrease of 0.060% in wage/income gap percentage.
It is essential to understand that the correlation between the percentage of Immigrants from Caribbean and wage/income gap percentage does not imply a direct cause-and-effect relationship. It remains uncertain whether the presence of Immigrants from Caribbean influences an upward or downward trend in the level of wage/income gap percentage within an area, or if Immigrants from Caribbean simply ended up residing in those areas with higher or lower levels of wage/income gap percentage due to other factors.
Demographics Similar to Immigrants from Caribbean by Wage/Income Gap
In terms of wage/income gap, the demographic groups most similar to Immigrants from Caribbean are Bahamian (20.2%, a difference of 0.72%), Immigrants from Liberia (20.6%, a difference of 0.79%), Immigrants from Dominican Republic (20.6%, a difference of 0.81%), Dominican (20.6%, a difference of 0.98%), and Senegalese (20.7%, a difference of 1.3%).
| Demographics | Rating | Rank | Wage/Income Gap |
| Immigrants from Trinidad and Tobago | 100.0 /100 | #14 | Exceptional 19.3% |
| West Indians | 100.0 /100 | #15 | Exceptional 19.6% |
| Jamaicans | 100.0 /100 | #16 | Exceptional 19.6% |
| Haitians | 100.0 /100 | #17 | Exceptional 19.7% |
| Hopi | 100.0 /100 | #18 | Exceptional 20.0% |
| Immigrants from Dominica | 100.0 /100 | #19 | Exceptional 20.0% |
| Bahamians | 100.0 /100 | #20 | Exceptional 20.2% |
| Immigrants from Caribbean | 100.0 /100 | #21 | Exceptional 20.4% |
| Immigrants from Liberia | 100.0 /100 | #22 | Exceptional 20.6% |
| Immigrants from Dominican Republic | 100.0 /100 | #23 | Exceptional 20.6% |
| Dominicans | 100.0 /100 | #24 | Exceptional 20.6% |
| Senegalese | 100.0 /100 | #25 | Exceptional 20.7% |
| Pueblo | 100.0 /100 | #26 | Exceptional 20.7% |
| Immigrants from Armenia | 100.0 /100 | #27 | Exceptional 20.7% |
| Inupiat | 100.0 /100 | #28 | Exceptional 20.8% |
Immigrants from Caribbean Wage/Income Gap Correlation Summary
| Measurement | Immigrants from Caribbean Data | Wage/Income Gap Data |
| Minimum | 0.14% | 1.9% |
| Maximum | 68.0% | 32.1% |
| Range | 67.9% | 30.2% |
| Mean | 24.4% | 19.4% |
| Median | 22.3% | 19.9% |
| Interquartile 25% (IQ1) | 11.2% | 15.8% |
| Interquartile 75% (IQ3) | 35.3% | 23.3% |
| Interquartile Range (IQR) | 24.1% | 7.5% |
| Standard Deviation (Sample) | 16.3% | 6.1% |
| Standard Deviation (Population) | 16.2% | 6.1% |
Correlation Details
| Immigrants from Caribbean Percentile | Sample Size | Wage/Income Gap |
[ 0.0% - 0.5% ] 0.14% | 214,365,302 | 28.2% |
[ 0.0% - 0.5% ] 0.43% | 79,663,551 | 25.6% |
[ 0.5% - 1.0% ] 0.77% | 34,919,024 | 25.9% |
[ 1.0% - 1.5% ] 1.08% | 19,960,120 | 24.9% |
[ 1.0% - 1.5% ] 1.38% | 12,113,326 | 23.4% |
[ 1.5% - 2.0% ] 1.70% | 9,199,358 | 24.5% |
[ 2.0% - 2.5% ] 2.01% | 7,981,299 | 23.7% |
[ 2.0% - 2.5% ] 2.31% | 6,245,047 | 22.3% |
[ 2.5% - 3.0% ] 2.64% | 4,982,395 | 21.9% |
[ 2.5% - 3.0% ] 2.91% | 4,484,050 | 20.4% |
[ 3.0% - 3.5% ] 3.24% | 2,727,564 | 22.6% |
[ 3.5% - 4.0% ] 3.56% | 2,237,991 | 22.5% |
[ 3.5% - 4.0% ] 3.87% | 2,107,128 | 23.7% |
[ 4.0% - 4.5% ] 4.19% | 1,758,154 | 21.2% |
[ 4.0% - 4.5% ] 4.47% | 1,739,094 | 22.5% |
[ 4.5% - 5.0% ] 4.80% | 1,604,397 | 22.3% |
[ 5.0% - 5.5% ] 5.10% | 1,354,666 | 21.9% |
[ 5.0% - 5.5% ] 5.42% | 1,379,711 | 20.5% |
[ 5.5% - 6.0% ] 5.71% | 1,142,959 | 19.3% |
[ 6.0% - 6.5% ] 6.04% | 1,652,856 | 22.0% |
[ 6.0% - 6.5% ] 6.35% | 896,952 | 21.8% |
[ 6.5% - 7.0% ] 6.67% | 1,142,457 | 22.4% |
[ 6.5% - 7.0% ] 6.93% | 1,048,364 | 20.1% |
[ 7.0% - 7.5% ] 7.23% | 1,353,804 | 20.1% |
[ 7.5% - 8.0% ] 7.56% | 798,637 | 24.6% |
[ 7.5% - 8.0% ] 7.91% | 845,853 | 24.3% |
[ 8.0% - 8.5% ] 8.19% | 681,939 | 23.9% |
[ 8.5% - 9.0% ] 8.57% | 1,309,378 | 19.6% |
[ 8.5% - 9.0% ] 8.83% | 414,951 | 19.3% |
[ 9.0% - 9.5% ] 9.15% | 566,275 | 18.9% |
[ 9.0% - 9.5% ] 9.47% | 873,609 | 21.3% |
[ 9.5% - 10.0% ] 9.82% | 9,194,714 | 15.3% |
[ 10.0% - 10.5% ] 10.04% | 369,228 | 24.9% |
[ 10.0% - 10.5% ] 10.34% | 550,946 | 20.0% |
[ 10.5% - 11.0% ] 10.73% | 116,570 | 28.7% |
[ 10.5% - 11.0% ] 10.98% | 581,448 | 21.2% |
[ 11.0% - 11.5% ] 11.37% | 396,879 | 20.9% |
[ 11.5% - 12.0% ] 11.58% | 597,865 | 18.9% |
[ 11.5% - 12.0% ] 11.94% | 652,446 | 20.6% |
[ 12.0% - 12.5% ] 12.23% | 667,235 | 21.4% |
[ 12.5% - 13.0% ] 12.51% | 304,290 | 23.3% |
[ 12.5% - 13.0% ] 12.90% | 244,115 | 29.0% |
[ 13.0% - 13.5% ] 13.15% | 247,306 | 17.0% |
[ 13.0% - 13.5% ] 13.49% | 304,024 | 18.5% |
[ 13.5% - 14.0% ] 13.79% | 420,741 | 21.9% |
[ 14.0% - 14.5% ] 14.01% | 151,379 | 13.7% |
[ 14.0% - 14.5% ] 14.35% | 597,702 | 18.4% |
[ 14.5% - 15.0% ] 14.73% | 320,291 | 18.1% |
[ 14.5% - 15.0% ] 14.98% | 330,345 | 15.9% |
[ 15.0% - 15.5% ] 15.29% | 325,318 | 19.9% |
[ 15.5% - 16.0% ] 15.66% | 169,309 | 16.4% |
[ 15.5% - 16.0% ] 15.92% | 109,805 | 14.4% |
[ 16.0% - 16.5% ] 16.26% | 212,031 | 17.2% |
[ 16.5% - 17.0% ] 16.61% | 370,147 | 17.7% |
[ 16.5% - 17.0% ] 16.90% | 605,243 | 16.4% |
[ 17.0% - 17.5% ] 17.16% | 283,731 | 15.3% |
[ 17.0% - 17.5% ] 17.43% | 221,404 | 16.8% |
[ 17.5% - 18.0% ] 17.69% | 60,268 | 14.8% |
[ 18.0% - 18.5% ] 18.05% | 299,765 | 18.6% |
[ 18.0% - 18.5% ] 18.29% | 39,768 | 16.6% |
[ 18.5% - 19.0% ] 18.69% | 265,280 | 22.6% |
[ 18.5% - 19.0% ] 18.96% | 131,557 | 19.5% |
[ 19.0% - 19.5% ] 19.29% | 131,982 | 14.6% |
[ 19.5% - 20.0% ] 19.68% | 260,686 | 17.1% |
[ 20.0% - 20.5% ] 20.04% | 220,417 | 25.3% |
[ 20.0% - 20.5% ] 20.32% | 44,503 | 6.7% |
[ 20.5% - 21.0% ] 20.70% | 212,055 | 22.8% |
[ 20.5% - 21.0% ] 20.91% | 258,757 | 16.9% |
[ 21.0% - 21.5% ] 21.19% | 314,382 | 17.5% |
[ 21.5% - 22.0% ] 21.59% | 165,351 | 24.2% |
[ 21.5% - 22.0% ] 21.94% | 79,817 | 31.2% |
[ 22.0% - 22.5% ] 22.14% | 234,023 | 21.1% |
[ 22.0% - 22.5% ] 22.45% | 444,921 | 15.2% |
[ 22.5% - 23.0% ] 22.92% | 195,693 | 22.4% |
[ 23.0% - 23.5% ] 23.03% | 184,030 | 15.7% |
[ 23.0% - 23.5% ] 23.42% | 399,810 | 21.0% |
[ 23.5% - 24.0% ] 23.79% | 49,318 | 27.5% |
[ 23.5% - 24.0% ] 23.95% | 120,060 | 9.2% |
[ 24.0% - 24.5% ] 24.16% | 29,400 | 15.2% |
[ 24.5% - 25.0% ] 24.99% | 82,011 | 20.9% |
[ 25.0% - 25.5% ] 25.30% | 125,014 | 26.3% |
[ 25.0% - 25.5% ] 25.46% | 42,404 | 7.8% |
[ 25.5% - 26.0% ] 25.96% | 27,491 | 25.4% |
[ 26.0% - 26.5% ] 26.18% | 34,760 | 18.8% |
[ 26.0% - 26.5% ] 26.42% | 134,829 | 18.3% |
[ 26.5% - 27.0% ] 26.91% | 68,832 | 25.8% |
[ 27.0% - 27.5% ] 27.09% | 200,454 | 15.1% |
[ 27.0% - 27.5% ] 27.40% | 177,910 | 10.8% |
[ 27.5% - 28.0% ] 27.66% | 193,399 | 17.2% |
[ 28.0% - 28.5% ] 28.06% | 86,601 | 12.0% |
[ 28.0% - 28.5% ] 28.35% | 192,003 | 19.0% |
[ 28.5% - 29.0% ] 28.63% | 88,917 | 23.2% |
[ 28.5% - 29.0% ] 28.87% | 83,669 | 4.1% |
[ 29.0% - 29.5% ] 29.27% | 94,023 | 20.8% |
[ 29.5% - 30.0% ] 29.51% | 517,199 | 23.5% |
[ 29.5% - 30.0% ] 29.85% | 145,958 | 13.2% |
[ 30.5% - 31.0% ] 30.51% | 128,523 | 11.0% |
[ 30.5% - 31.0% ] 30.80% | 90,432 | 21.8% |
[ 31.0% - 31.5% ] 31.20% | 37,954 | 32.1% |
[ 31.0% - 31.5% ] 31.47% | 128,256 | 18.9% |
[ 32.0% - 32.5% ] 32.04% | 29,240 | 1.9% |
[ 32.0% - 32.5% ] 32.29% | 72,002 | 24.5% |
[ 32.5% - 33.0% ] 32.59% | 162,741 | 17.3% |
[ 33.0% - 33.5% ] 33.33% | 121,630 | 21.4% |
[ 33.5% - 34.0% ] 33.59% | 13,781 | 14.8% |
[ 33.5% - 34.0% ] 33.82% | 152,082 | 5.0% |
[ 34.5% - 35.0% ] 34.82% | 221,208 | 14.0% |
[ 35.0% - 35.5% ] 35.14% | 130,749 | 15.7% |
[ 35.0% - 35.5% ] 35.41% | 73,798 | 17.8% |
[ 35.5% - 36.0% ] 35.89% | 90,475 | 12.0% |
[ 36.5% - 37.0% ] 36.77% | 60,466 | 25.2% |
[ 36.5% - 37.0% ] 36.93% | 47,116 | 13.3% |
[ 37.0% - 37.5% ] 37.34% | 131,244 | 10.9% |
[ 37.5% - 38.0% ] 37.54% | 20,140 | 14.5% |
[ 38.0% - 38.5% ] 38.01% | 129,669 | 16.2% |
[ 38.5% - 39.0% ] 38.57% | 9,971 | 25.7% |
[ 39.0% - 39.5% ] 39.21% | 34,725 | 12.1% |
[ 39.5% - 40.0% ] 39.53% | 98,575 | 16.6% |
[ 39.5% - 40.0% ] 39.91% | 35,914 | 18.6% |
[ 40.5% - 41.0% ] 40.77% | 13,877 | 32.1% |
[ 41.0% - 41.5% ] 41.07% | 75,037 | 21.5% |
[ 41.0% - 41.5% ] 41.40% | 69,663 | 18.8% |
[ 42.0% - 42.5% ] 42.22% | 13,824 | 2.8% |
[ 42.5% - 43.0% ] 42.68% | 34,335 | 30.8% |
[ 43.5% - 44.0% ] 43.57% | 52,661 | 21.7% |
[ 44.5% - 45.0% ] 44.60% | 19,399 | 29.2% |
[ 46.0% - 46.5% ] 46.20% | 1,775 | 8.0% |
[ 46.5% - 47.0% ] 46.51% | 55,241 | 31.3% |
[ 46.5% - 47.0% ] 46.83% | 24,597 | 14.8% |
[ 48.0% - 48.5% ] 48.31% | 40,739 | 11.2% |
[ 48.5% - 49.0% ] 48.55% | 10,725 | 5.1% |
[ 49.0% - 49.5% ] 49.08% | 52,851 | 15.6% |
[ 49.0% - 49.5% ] 49.45% | 53,765 | 31.6% |
[ 50.0% - 50.5% ] 50.47% | 50,233 | 17.5% |
[ 51.5% - 52.0% ] 51.94% | 46,798 | 28.3% |
[ 53.0% - 53.5% ] 53.39% | 52,047 | 15.1% |
[ 55.0% - 55.5% ] 55.34% | 45,620 | 19.5% |
[ 55.5% - 56.0% ] 55.83% | 20,850 | 5.9% |
[ 56.5% - 57.0% ] 56.81% | 22,815 | 21.5% |
[ 58.5% - 59.0% ] 58.50% | 26,596 | 16.5% |
[ 61.5% - 62.0% ] 61.95% | 224,014 | 24.2% |
[ 65.0% - 65.5% ] 65.40% | 29,830 | 28.1% |
[ 65.5% - 66.0% ] 65.67% | 71,088 | 20.9% |
[ 68.0% - 68.5% ] 68.02% | 42,081 | 27.6% |