Nonimmigrants Wage/Income Gap
COMPARE
Nonimmigrants
Select to Compare
Wage/Income Gap
Nonimmigrants Wage/Income Gap
27.2%
WAGE/INCOME GAP
3.3/ 100
METRIC RATING
246th/ 347
METRIC RANK
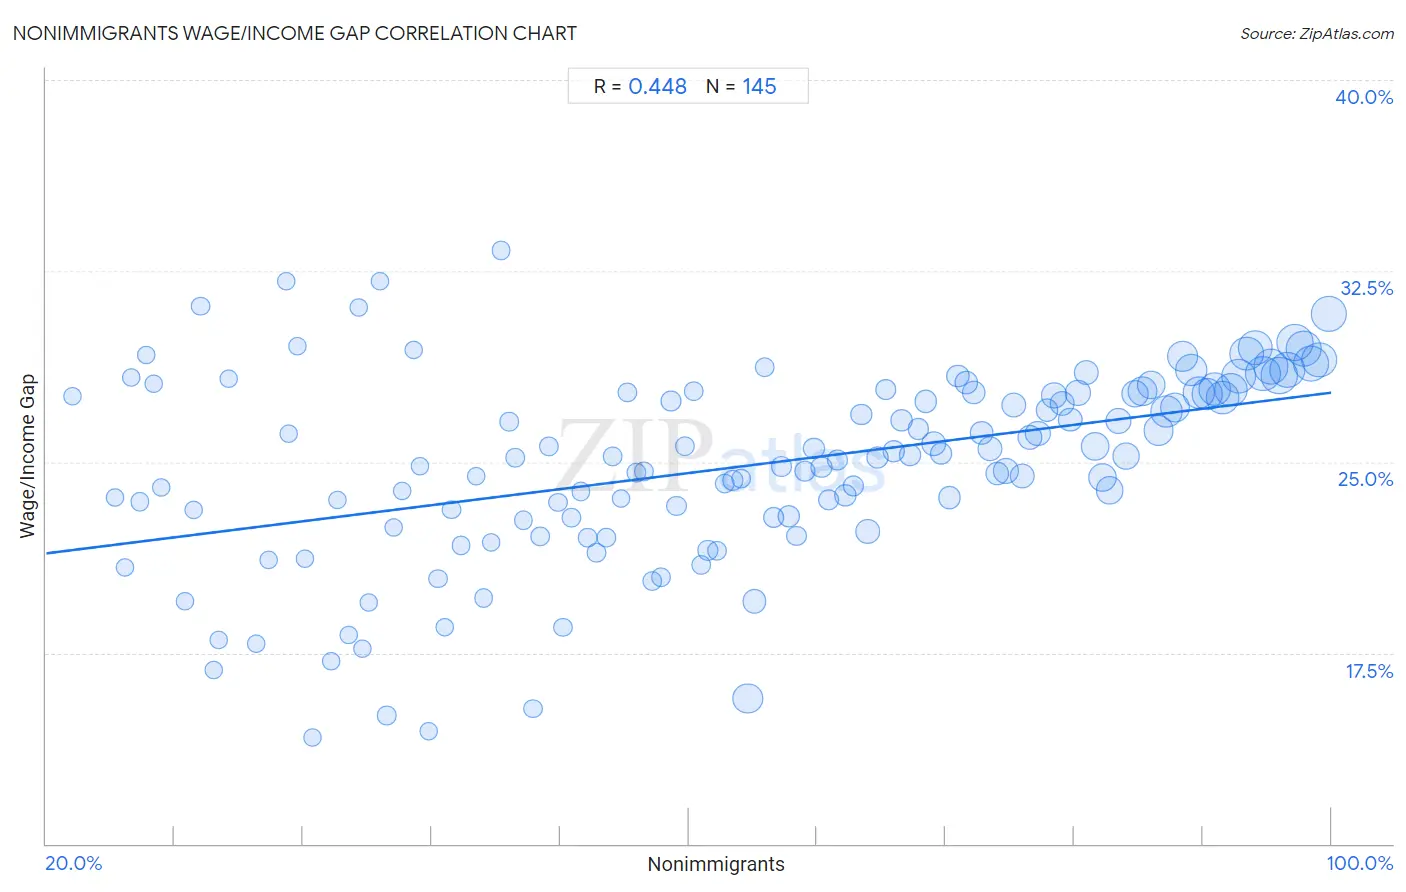
Nonimmigrants Wage/Income Gap Correlation Chart
The statistical analysis conducted on geographies consisting of 579,671,089 people shows a moderate positive correlation between the proportion of Nonimmigrants and wage/income gap percentage in the United States with a correlation coefficient (R) of 0.448 and weighted average of 27.2%. On average, for every 1% (one percent) increase in Nonimmigrants within a typical geography, there is an increase of 0.079% in wage/income gap percentage.
It is essential to understand that the correlation between the percentage of Nonimmigrants and wage/income gap percentage does not imply a direct cause-and-effect relationship. It remains uncertain whether the presence of Nonimmigrants influences an upward or downward trend in the level of wage/income gap percentage within an area, or if Nonimmigrants simply ended up residing in those areas with higher or lower levels of wage/income gap percentage due to other factors.
Demographics Similar to Nonimmigrants by Wage/Income Gap
In terms of wage/income gap, the demographic groups most similar to Nonimmigrants are Immigrants from the Azores (27.2%, a difference of 0.080%), Chickasaw (27.2%, a difference of 0.090%), Spanish (27.1%, a difference of 0.16%), Immigrants from Sri Lanka (27.1%, a difference of 0.17%), and Creek (27.1%, a difference of 0.22%).
| Demographics | Rating | Rank | Wage/Income Gap |
| Estonians | 4.3 /100 | #239 | Tragic 27.1% |
| Immigrants from Europe | 3.8 /100 | #240 | Tragic 27.1% |
| Creek | 3.8 /100 | #241 | Tragic 27.1% |
| Immigrants from Sri Lanka | 3.7 /100 | #242 | Tragic 27.1% |
| Spanish | 3.6 /100 | #243 | Tragic 27.1% |
| Chickasaw | 3.5 /100 | #244 | Tragic 27.2% |
| Immigrants from the Azores | 3.5 /100 | #245 | Tragic 27.2% |
| Nonimmigrants | 3.3 /100 | #246 | Tragic 27.2% |
| Celtics | 2.8 /100 | #247 | Tragic 27.3% |
| Cypriots | 2.8 /100 | #248 | Tragic 27.3% |
| Carpatho Rusyns | 2.7 /100 | #249 | Tragic 27.3% |
| Immigrants from Czechoslovakia | 2.7 /100 | #250 | Tragic 27.3% |
| Immigrants from Norway | 2.5 /100 | #251 | Tragic 27.3% |
| Ukrainians | 2.4 /100 | #252 | Tragic 27.3% |
| Portuguese | 2.2 /100 | #253 | Tragic 27.4% |
Nonimmigrants Wage/Income Gap Correlation Summary
| Measurement | Nonimmigrants Data | Wage/Income Gap Data |
| Minimum | 21.6% | 14.2% |
| Maximum | 99.8% | 33.3% |
| Range | 78.2% | 19.1% |
| Mean | 63.3% | 24.8% |
| Median | 63.7% | 25.2% |
| Interquartile 25% (IQ1) | 45.0% | 22.8% |
| Interquartile 75% (IQ3) | 82.0% | 27.7% |
| Interquartile Range (IQR) | 37.0% | 5.0% |
| Standard Deviation (Sample) | 21.7% | 3.8% |
| Standard Deviation (Population) | 21.6% | 3.8% |
Correlation Details
| Nonimmigrants Percentile | Sample Size | Wage/Income Gap |
[ 21.5% - 22.0% ] 21.63% | 42,081 | 27.6% |
[ 24.0% - 24.5% ] 24.26% | 1,018 | 23.6% |
[ 24.5% - 25.0% ] 24.90% | 71,088 | 20.9% |
[ 25.0% - 25.5% ] 25.32% | 46,798 | 28.3% |
[ 25.5% - 26.0% ] 25.85% | 257,738 | 23.4% |
[ 26.0% - 26.5% ] 26.25% | 19,399 | 29.2% |
[ 26.5% - 27.0% ] 26.69% | 29,830 | 28.1% |
[ 27.0% - 27.5% ] 27.15% | 57,226 | 24.0% |
[ 28.5% - 29.0% ] 28.63% | 45,620 | 19.5% |
[ 29.0% - 29.5% ] 29.21% | 137,895 | 23.1% |
[ 29.5% - 30.0% ] 29.61% | 115,169 | 31.1% |
[ 30.0% - 30.5% ] 30.42% | 766 | 16.8% |
[ 30.5% - 31.0% ] 30.74% | 90,791 | 18.0% |
[ 31.0% - 31.5% ] 31.32% | 119,624 | 28.3% |
[ 33.0% - 33.5% ] 33.09% | 109,218 | 17.9% |
[ 33.5% - 34.0% ] 33.83% | 152,851 | 21.2% |
[ 34.5% - 35.0% ] 34.92% | 51,333 | 32.1% |
[ 35.0% - 35.5% ] 35.12% | 104,741 | 26.1% |
[ 35.5% - 36.0% ] 35.67% | 109,357 | 29.5% |
[ 36.0% - 36.5% ] 36.09% | 115,520 | 21.2% |
[ 36.5% - 37.0% ] 36.57% | 26,419 | 14.2% |
[ 37.5% - 38.0% ] 37.72% | 93,794 | 17.2% |
[ 38.0% - 38.5% ] 38.12% | 128,561 | 23.5% |
[ 38.5% - 39.0% ] 38.87% | 58,079 | 18.2% |
[ 39.0% - 39.5% ] 39.47% | 35,967 | 31.1% |
[ 39.5% - 40.0% ] 39.70% | 153,212 | 17.7% |
[ 40.0% - 40.5% ] 40.08% | 15,483 | 19.5% |
[ 40.5% - 41.0% ] 40.81% | 85,497 | 32.1% |
[ 41.0% - 41.5% ] 41.20% | 221,458 | 15.0% |
[ 41.5% - 42.0% ] 41.66% | 98,125 | 22.4% |
[ 42.0% - 42.5% ] 42.16% | 597,246 | 23.9% |
[ 42.5% - 43.0% ] 42.87% | 110,375 | 29.4% |
[ 43.0% - 43.5% ] 43.29% | 75,557 | 24.8% |
[ 43.5% - 44.0% ] 43.83% | 91,247 | 14.4% |
[ 44.0% - 44.5% ] 44.39% | 148,280 | 20.4% |
[ 44.5% - 45.0% ] 44.82% | 482,691 | 18.5% |
[ 45.0% - 45.5% ] 45.22% | 593,586 | 23.1% |
[ 45.5% - 46.0% ] 45.83% | 373,431 | 21.7% |
[ 46.5% - 47.0% ] 46.77% | 136,298 | 24.5% |
[ 47.0% - 47.5% ] 47.24% | 236,458 | 19.7% |
[ 47.5% - 48.0% ] 47.68% | 204,872 | 21.8% |
[ 48.0% - 48.5% ] 48.33% | 305,356 | 33.3% |
[ 48.5% - 49.0% ] 48.82% | 319,766 | 26.6% |
[ 49.0% - 49.5% ] 49.21% | 730,358 | 25.2% |
[ 49.5% - 50.0% ] 49.72% | 640,490 | 22.7% |
[ 50.0% - 50.5% ] 50.31% | 163,809 | 15.3% |
[ 50.5% - 51.0% ] 50.72% | 847,079 | 22.1% |
[ 51.0% - 51.5% ] 51.26% | 845,241 | 25.6% |
[ 51.5% - 52.0% ] 51.86% | 168,845 | 23.4% |
[ 52.0% - 52.5% ] 52.17% | 277,496 | 18.5% |
[ 52.5% - 53.0% ] 52.70% | 841,252 | 22.8% |
[ 53.0% - 53.5% ] 53.28% | 703,197 | 23.8% |
[ 53.5% - 54.0% ] 53.70% | 775,770 | 22.0% |
[ 54.0% - 54.5% ] 54.25% | 709,591 | 21.4% |
[ 54.5% - 55.0% ] 54.86% | 864,566 | 22.0% |
[ 55.0% - 55.5% ] 55.28% | 858,196 | 25.2% |
[ 55.5% - 56.0% ] 55.80% | 368,068 | 23.6% |
[ 56.0% - 56.5% ] 56.21% | 1,287,360 | 27.7% |
[ 56.5% - 57.0% ] 56.74% | 889,554 | 24.6% |
[ 57.0% - 57.5% ] 57.22% | 813,133 | 24.6% |
[ 57.5% - 58.0% ] 57.72% | 1,498,492 | 20.3% |
[ 58.0% - 58.5% ] 58.27% | 1,523,960 | 20.5% |
[ 58.5% - 59.0% ] 58.89% | 2,636,733 | 27.4% |
[ 59.0% - 59.5% ] 59.24% | 1,730,431 | 23.3% |
[ 59.5% - 60.0% ] 59.75% | 1,247,639 | 25.6% |
[ 60.0% - 60.5% ] 60.31% | 1,208,757 | 27.8% |
[ 60.5% - 61.0% ] 60.77% | 1,153,771 | 21.0% |
[ 61.0% - 61.5% ] 61.19% | 1,608,627 | 21.5% |
[ 61.5% - 62.0% ] 61.77% | 1,926,717 | 21.5% |
[ 62.0% - 62.5% ] 62.24% | 1,535,090 | 24.1% |
[ 62.5% - 63.0% ] 62.74% | 1,594,041 | 24.3% |
[ 63.0% - 63.5% ] 63.23% | 1,321,623 | 24.4% |
[ 63.5% - 64.0% ] 63.68% | 10,443,886 | 15.7% |
[ 64.0% - 64.5% ] 64.09% | 5,380,274 | 19.5% |
[ 64.5% - 65.0% ] 64.74% | 1,581,483 | 28.7% |
[ 65.0% - 65.5% ] 65.26% | 2,389,278 | 22.8% |
[ 65.5% - 66.0% ] 65.77% | 1,747,997 | 24.8% |
[ 66.0% - 66.5% ] 66.26% | 3,244,831 | 22.9% |
[ 66.5% - 67.0% ] 66.73% | 1,733,854 | 22.1% |
[ 67.0% - 67.5% ] 67.25% | 2,360,360 | 24.6% |
[ 67.5% - 68.0% ] 67.79% | 2,885,198 | 25.5% |
[ 68.0% - 68.5% ] 68.25% | 2,831,307 | 24.8% |
[ 68.5% - 69.0% ] 68.69% | 2,412,502 | 23.5% |
[ 69.0% - 69.5% ] 69.26% | 2,237,746 | 25.1% |
[ 69.5% - 70.0% ] 69.73% | 2,696,651 | 23.7% |
[ 70.0% - 70.5% ] 70.24% | 2,777,196 | 24.1% |
[ 70.5% - 71.0% ] 70.73% | 3,115,214 | 26.9% |
[ 71.0% - 71.5% ] 71.14% | 5,102,442 | 22.3% |
[ 71.5% - 72.0% ] 71.76% | 3,345,054 | 25.2% |
[ 72.0% - 72.5% ] 72.27% | 2,967,445 | 27.8% |
[ 72.5% - 73.0% ] 72.73% | 3,313,784 | 25.4% |
[ 73.0% - 73.5% ] 73.24% | 2,750,551 | 26.6% |
[ 73.5% - 74.0% ] 73.76% | 3,197,642 | 25.3% |
[ 74.0% - 74.5% ] 74.31% | 2,914,263 | 26.3% |
[ 74.5% - 75.0% ] 74.75% | 4,173,743 | 27.4% |
[ 75.0% - 75.5% ] 75.25% | 5,513,068 | 25.7% |
[ 75.5% - 76.0% ] 75.72% | 3,607,949 | 25.3% |
[ 76.0% - 76.5% ] 76.24% | 4,190,489 | 23.6% |
[ 76.5% - 77.0% ] 76.76% | 3,753,333 | 28.4% |
[ 77.0% - 77.5% ] 77.27% | 4,302,152 | 28.1% |
[ 77.5% - 78.0% ] 77.77% | 4,418,513 | 27.7% |
[ 78.0% - 78.5% ] 78.23% | 3,708,485 | 26.1% |
[ 78.5% - 79.0% ] 78.77% | 5,550,061 | 25.5% |
[ 79.0% - 79.5% ] 79.23% | 4,826,370 | 24.6% |
[ 79.5% - 80.0% ] 79.73% | 7,112,777 | 24.6% |
[ 80.0% - 80.5% ] 80.27% | 5,455,531 | 27.2% |
[ 80.5% - 81.0% ] 80.74% | 5,931,655 | 24.4% |
[ 81.0% - 81.5% ] 81.22% | 5,658,687 | 26.0% |
[ 81.5% - 82.0% ] 81.75% | 5,981,144 | 26.1% |
[ 82.0% - 82.5% ] 82.30% | 4,118,538 | 27.0% |
[ 82.5% - 83.0% ] 82.75% | 5,942,753 | 27.6% |
[ 83.0% - 83.5% ] 83.26% | 6,083,847 | 27.3% |
[ 83.5% - 84.0% ] 83.77% | 4,988,419 | 26.7% |
[ 84.0% - 84.5% ] 84.23% | 5,906,748 | 27.7% |
[ 84.5% - 85.0% ] 84.77% | 5,433,652 | 28.5% |
[ 85.0% - 85.5% ] 85.27% | 8,566,041 | 25.6% |
[ 85.5% - 86.0% ] 85.76% | 8,796,924 | 24.4% |
[ 86.0% - 86.5% ] 86.20% | 8,288,465 | 23.9% |
[ 86.5% - 87.0% ] 86.75% | 7,126,533 | 26.6% |
[ 87.0% - 87.5% ] 87.25% | 7,932,447 | 25.2% |
[ 87.5% - 88.0% ] 87.78% | 7,674,416 | 27.7% |
[ 88.0% - 88.5% ] 88.24% | 9,908,004 | 27.8% |
[ 88.5% - 89.0% ] 88.76% | 8,893,068 | 28.0% |
[ 89.0% - 89.5% ] 89.26% | 10,230,203 | 26.2% |
[ 89.5% - 90.0% ] 89.74% | 11,674,108 | 27.0% |
[ 90.0% - 90.5% ] 90.24% | 9,867,922 | 27.1% |
[ 90.5% - 91.0% ] 90.75% | 10,767,960 | 29.1% |
[ 91.0% - 91.5% ] 91.26% | 12,065,727 | 28.6% |
[ 91.5% - 92.0% ] 91.77% | 11,929,869 | 27.7% |
[ 92.0% - 92.5% ] 92.26% | 11,569,097 | 27.7% |
[ 92.5% - 93.0% ] 92.76% | 12,579,720 | 27.9% |
[ 93.0% - 93.5% ] 93.25% | 13,048,756 | 27.5% |
[ 93.5% - 94.0% ] 93.76% | 13,661,083 | 27.8% |
[ 94.0% - 94.5% ] 94.25% | 14,423,860 | 28.4% |
[ 94.5% - 95.0% ] 94.74% | 13,441,795 | 29.3% |
[ 95.0% - 95.5% ] 95.25% | 13,866,081 | 29.5% |
[ 95.5% - 96.0% ] 95.75% | 14,573,181 | 28.5% |
[ 96.0% - 96.5% ] 96.25% | 14,802,744 | 28.7% |
[ 96.5% - 97.0% ] 96.76% | 15,614,025 | 28.4% |
[ 97.0% - 97.5% ] 97.26% | 15,696,111 | 28.6% |
[ 97.5% - 98.0% ] 97.76% | 16,482,504 | 29.7% |
[ 98.0% - 98.5% ] 98.25% | 15,546,057 | 29.4% |
[ 98.5% - 99.0% ] 98.75% | 15,674,115 | 28.9% |
[ 99.0% - 99.5% ] 99.24% | 14,639,150 | 29.0% |
[ 99.5% - 100.0% ] 99.82% | 15,204,544 | 30.8% |