Immigrants from Trinidad and Tobago Wage/Income Gap
COMPARE
Immigrants from Trinidad and Tobago
Select to Compare
Wage/Income Gap
Immigrants from Trinidad and Tobago Wage/Income Gap
19.3%
WAGE/INCOME GAP
100.0/ 100
METRIC RATING
14th/ 347
METRIC RANK
Immigrants from Trinidad and Tobago Wage/Income Gap Correlation Chart
The statistical analysis conducted on geographies consisting of 223,459,768 people shows a poor negative correlation between the proportion of Immigrants from Trinidad and Tobago and wage/income gap percentage in the United States with a correlation coefficient (R) of -0.143 and weighted average of 19.3%. On average, for every 1% (one percent) increase in Immigrants from Trinidad and Tobago within a typical geography, there is a decrease of 0.86% in wage/income gap percentage.
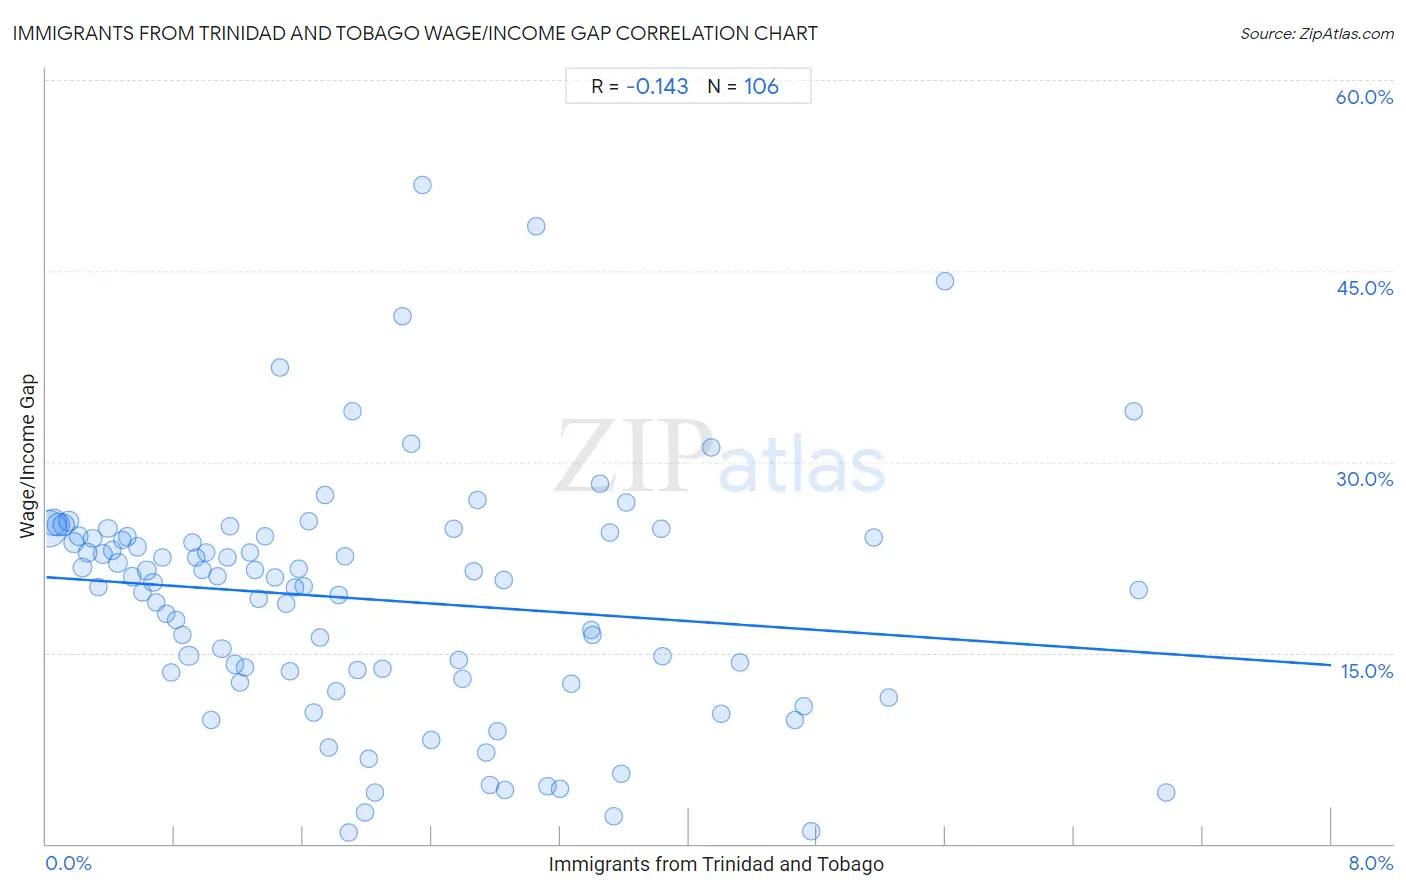
It is essential to understand that the correlation between the percentage of Immigrants from Trinidad and Tobago and wage/income gap percentage does not imply a direct cause-and-effect relationship. It remains uncertain whether the presence of Immigrants from Trinidad and Tobago influences an upward or downward trend in the level of wage/income gap percentage within an area, or if Immigrants from Trinidad and Tobago simply ended up residing in those areas with higher or lower levels of wage/income gap percentage due to other factors.
Demographics Similar to Immigrants from Trinidad and Tobago by Wage/Income Gap
In terms of wage/income gap, the demographic groups most similar to Immigrants from Trinidad and Tobago are Trinidadian and Tobagonian (19.3%, a difference of 0.050%), Immigrants from West Indies (19.2%, a difference of 0.53%), Immigrants from Haiti (19.2%, a difference of 0.64%), West Indian (19.6%, a difference of 1.2%), and Jamaican (19.6%, a difference of 1.3%).
| Demographics | Rating | Rank | Wage/Income Gap |
| Puerto Ricans | 100.0 /100 | #7 | Exceptional 18.7% |
| Immigrants from Jamaica | 100.0 /100 | #8 | Exceptional 18.8% |
| Barbadians | 100.0 /100 | #9 | Exceptional 19.0% |
| Crow | 100.0 /100 | #10 | Exceptional 19.1% |
| Immigrants from Haiti | 100.0 /100 | #11 | Exceptional 19.2% |
| Immigrants from West Indies | 100.0 /100 | #12 | Exceptional 19.2% |
| Trinidadians and Tobagonians | 100.0 /100 | #13 | Exceptional 19.3% |
| Immigrants from Trinidad and Tobago | 100.0 /100 | #14 | Exceptional 19.3% |
| West Indians | 100.0 /100 | #15 | Exceptional 19.6% |
| Jamaicans | 100.0 /100 | #16 | Exceptional 19.6% |
| Haitians | 100.0 /100 | #17 | Exceptional 19.7% |
| Hopi | 100.0 /100 | #18 | Exceptional 20.0% |
| Immigrants from Dominica | 100.0 /100 | #19 | Exceptional 20.0% |
| Bahamians | 100.0 /100 | #20 | Exceptional 20.2% |
| Immigrants from Caribbean | 100.0 /100 | #21 | Exceptional 20.4% |
Immigrants from Trinidad and Tobago Wage/Income Gap Correlation Summary
| Measurement | Immigrants from Trinidad and Tobago Data | Wage/Income Gap Data |
| Minimum | 0.016% | 0.88% |
| Maximum | 7.0% | 51.8% |
| Range | 7.0% | 50.9% |
| Mean | 2.0% | 19.2% |
| Median | 1.6% | 20.6% |
| Interquartile 25% (IQ1) | 0.81% | 13.4% |
| Interquartile 75% (IQ3) | 2.8% | 24.1% |
| Interquartile Range (IQR) | 2.0% | 10.7% |
| Standard Deviation (Sample) | 1.6% | 9.5% |
| Standard Deviation (Population) | 1.6% | 9.5% |
Correlation Details
| Immigrants from Trinidad and Tobago Percentile | Sample Size | Wage/Income Gap |
[ 0.0% - 0.5% ] 0.016% | 75,514,790 | 24.7% |
[ 0.0% - 0.5% ] 0.045% | 36,386,481 | 25.2% |
[ 0.0% - 0.5% ] 0.075% | 23,605,350 | 25.1% |
[ 0.0% - 0.5% ] 0.11% | 15,385,373 | 25.1% |
[ 0.0% - 0.5% ] 0.14% | 10,224,801 | 25.3% |
[ 0.0% - 0.5% ] 0.17% | 9,346,991 | 23.7% |
[ 0.0% - 0.5% ] 0.20% | 5,509,559 | 24.2% |
[ 0.0% - 0.5% ] 0.23% | 4,979,339 | 21.7% |
[ 0.0% - 0.5% ] 0.26% | 3,812,604 | 22.9% |
[ 0.0% - 0.5% ] 0.29% | 3,180,388 | 24.0% |
[ 0.0% - 0.5% ] 0.32% | 2,891,220 | 20.2% |
[ 0.0% - 0.5% ] 0.35% | 2,702,929 | 22.8% |
[ 0.0% - 0.5% ] 0.38% | 2,141,125 | 24.8% |
[ 0.0% - 0.5% ] 0.41% | 1,771,781 | 23.0% |
[ 0.0% - 0.5% ] 0.45% | 1,810,563 | 22.1% |
[ 0.0% - 0.5% ] 0.47% | 1,002,929 | 23.9% |
[ 0.5% - 1.0% ] 0.51% | 1,257,814 | 24.1% |
[ 0.5% - 1.0% ] 0.54% | 1,372,681 | 21.0% |
[ 0.5% - 1.0% ] 0.57% | 629,536 | 23.3% |
[ 0.5% - 1.0% ] 0.60% | 639,552 | 19.8% |
[ 0.5% - 1.0% ] 0.63% | 611,456 | 21.5% |
[ 0.5% - 1.0% ] 0.66% | 1,012,234 | 20.5% |
[ 0.5% - 1.0% ] 0.69% | 524,877 | 19.0% |
[ 0.5% - 1.0% ] 0.72% | 307,022 | 22.5% |
[ 0.5% - 1.0% ] 0.75% | 209,896 | 18.1% |
[ 0.5% - 1.0% ] 0.78% | 431,784 | 13.4% |
[ 0.5% - 1.0% ] 0.81% | 377,263 | 17.5% |
[ 0.5% - 1.0% ] 0.85% | 779,599 | 16.4% |
[ 0.5% - 1.0% ] 0.89% | 9,105,879 | 14.8% |
[ 0.5% - 1.0% ] 0.91% | 249,872 | 23.7% |
[ 0.5% - 1.0% ] 0.94% | 154,761 | 22.5% |
[ 0.5% - 1.0% ] 0.97% | 201,660 | 21.5% |
[ 0.5% - 1.0% ] 1.00% | 251,033 | 22.8% |
[ 1.0% - 1.5% ] 1.02% | 271,131 | 9.7% |
[ 1.0% - 1.5% ] 1.06% | 129,020 | 21.0% |
[ 1.0% - 1.5% ] 1.09% | 295,756 | 15.3% |
[ 1.0% - 1.5% ] 1.13% | 114,448 | 22.5% |
[ 1.0% - 1.5% ] 1.14% | 101,038 | 24.9% |
[ 1.0% - 1.5% ] 1.18% | 271,442 | 14.1% |
[ 1.0% - 1.5% ] 1.20% | 82,351 | 12.6% |
[ 1.0% - 1.5% ] 1.24% | 259,713 | 13.9% |
[ 1.0% - 1.5% ] 1.27% | 77,080 | 22.8% |
[ 1.0% - 1.5% ] 1.30% | 259,326 | 21.5% |
[ 1.0% - 1.5% ] 1.32% | 20,931 | 19.2% |
[ 1.0% - 1.5% ] 1.36% | 51,452 | 24.1% |
[ 1.0% - 1.5% ] 1.42% | 110,190 | 20.9% |
[ 1.0% - 1.5% ] 1.45% | 75,816 | 37.4% |
[ 1.0% - 1.5% ] 1.49% | 159,013 | 18.9% |
[ 1.5% - 2.0% ] 1.52% | 28,841 | 13.5% |
[ 1.5% - 2.0% ] 1.55% | 130,783 | 20.2% |
[ 1.5% - 2.0% ] 1.57% | 36,678 | 21.6% |
[ 1.5% - 2.0% ] 1.60% | 100,450 | 20.2% |
[ 1.5% - 2.0% ] 1.63% | 35,744 | 25.4% |
[ 1.5% - 2.0% ] 1.67% | 56,182 | 10.3% |
[ 1.5% - 2.0% ] 1.70% | 47,515 | 16.2% |
[ 1.5% - 2.0% ] 1.73% | 40,484 | 27.4% |
[ 1.5% - 2.0% ] 1.76% | 145,080 | 7.6% |
[ 1.5% - 2.0% ] 1.80% | 20,336 | 12.0% |
[ 1.5% - 2.0% ] 1.82% | 115,966 | 19.6% |
[ 1.5% - 2.0% ] 1.86% | 43,396 | 22.6% |
[ 1.5% - 2.0% ] 1.89% | 10,821 | 0.88% |
[ 1.5% - 2.0% ] 1.90% | 29,348 | 33.9% |
[ 1.5% - 2.0% ] 1.94% | 55,114 | 13.7% |
[ 1.5% - 2.0% ] 1.98% | 55,336 | 2.5% |
[ 2.0% - 2.5% ] 2.01% | 40,738 | 6.6% |
[ 2.0% - 2.5% ] 2.05% | 52,000 | 4.0% |
[ 2.0% - 2.5% ] 2.09% | 47,691 | 13.7% |
[ 2.0% - 2.5% ] 2.22% | 4,910 | 41.4% |
[ 2.0% - 2.5% ] 2.27% | 18,470 | 31.4% |
[ 2.0% - 2.5% ] 2.34% | 898 | 51.8% |
[ 2.0% - 2.5% ] 2.40% | 65,645 | 8.1% |
[ 2.5% - 3.0% ] 2.54% | 2,720 | 24.8% |
[ 2.5% - 3.0% ] 2.57% | 96,801 | 14.5% |
[ 2.5% - 3.0% ] 2.59% | 189,692 | 13.0% |
[ 2.5% - 3.0% ] 2.66% | 10,526 | 21.4% |
[ 2.5% - 3.0% ] 2.68% | 5,740 | 27.0% |
[ 2.5% - 3.0% ] 2.74% | 108,992 | 7.2% |
[ 2.5% - 3.0% ] 2.77% | 79,458 | 4.6% |
[ 2.5% - 3.0% ] 2.81% | 32,296 | 8.8% |
[ 2.5% - 3.0% ] 2.85% | 6,529 | 20.7% |
[ 2.5% - 3.0% ] 2.86% | 67,242 | 4.3% |
[ 3.0% - 3.5% ] 3.05% | 17,400 | 48.5% |
[ 3.0% - 3.5% ] 3.12% | 83,125 | 4.5% |
[ 3.0% - 3.5% ] 3.20% | 9,011 | 4.4% |
[ 3.0% - 3.5% ] 3.26% | 24,994 | 12.5% |
[ 3.0% - 3.5% ] 3.39% | 30,946 | 16.7% |
[ 3.0% - 3.5% ] 3.40% | 69,131 | 16.4% |
[ 3.0% - 3.5% ] 3.45% | 55,143 | 28.3% |
[ 3.5% - 4.0% ] 3.51% | 84,006 | 24.4% |
[ 3.5% - 4.0% ] 3.53% | 27,845 | 2.2% |
[ 3.5% - 4.0% ] 3.58% | 100,082 | 5.5% |
[ 3.5% - 4.0% ] 3.61% | 3,270 | 26.8% |
[ 3.5% - 4.0% ] 3.83% | 58,396 | 24.7% |
[ 3.5% - 4.0% ] 3.84% | 5,938 | 14.8% |
[ 4.0% - 4.5% ] 4.14% | 8,260 | 31.1% |
[ 4.0% - 4.5% ] 4.20% | 8,779 | 10.2% |
[ 4.0% - 4.5% ] 4.32% | 21,349 | 14.2% |
[ 4.5% - 5.0% ] 4.66% | 63,426 | 9.7% |
[ 4.5% - 5.0% ] 4.72% | 101,648 | 10.8% |
[ 4.5% - 5.0% ] 4.77% | 2,980 | 1.0% |
[ 5.0% - 5.5% ] 5.15% | 2,231 | 24.0% |
[ 5.0% - 5.5% ] 5.24% | 58,476 | 11.5% |
[ 5.5% - 6.0% ] 5.59% | 1,055 | 44.1% |
[ 6.5% - 7.0% ] 6.77% | 251 | 34.0% |
[ 6.5% - 7.0% ] 6.80% | 99,249 | 20.0% |
[ 6.5% - 7.0% ] 6.98% | 78,506 | 4.0% |