Belizean Wage/Income Gap
COMPARE
Belizean
Select to Compare
Wage/Income Gap
Belizean Wage/Income Gap
21.2%
WAGE/INCOME GAP
100.0/ 100
METRIC RATING
36th/ 347
METRIC RANK
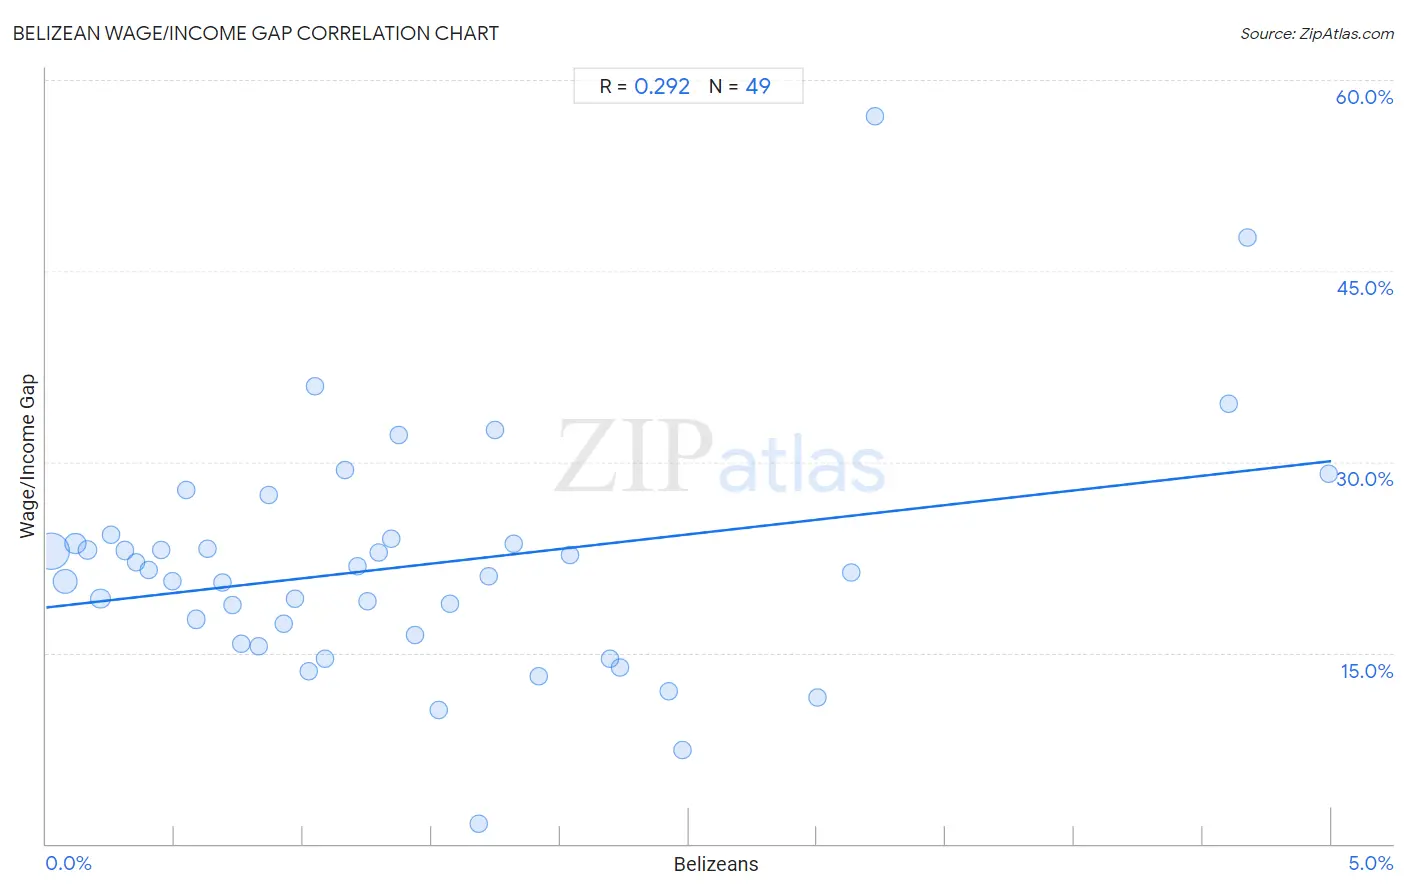
Belizean Wage/Income Gap Correlation Chart
The statistical analysis conducted on geographies consisting of 144,188,181 people shows a weak positive correlation between the proportion of Belizeans and wage/income gap percentage in the United States with a correlation coefficient (R) of 0.292 and weighted average of 21.2%. On average, for every 1% (one percent) increase in Belizeans within a typical geography, there is an increase of 2.3% in wage/income gap percentage.
It is essential to understand that the correlation between the percentage of Belizeans and wage/income gap percentage does not imply a direct cause-and-effect relationship. It remains uncertain whether the presence of Belizeans influences an upward or downward trend in the level of wage/income gap percentage within an area, or if Belizeans simply ended up residing in those areas with higher or lower levels of wage/income gap percentage due to other factors.
Demographics Similar to Belizeans by Wage/Income Gap
In terms of wage/income gap, the demographic groups most similar to Belizeans are Somali (21.2%, a difference of 0.020%), Immigrants from Somalia (21.2%, a difference of 0.070%), Immigrants from Belize (21.3%, a difference of 0.12%), Colville (21.3%, a difference of 0.23%), and Lumbee (21.3%, a difference of 0.43%).
| Demographics | Rating | Rank | Wage/Income Gap |
| Immigrants from Senegal | 100.0 /100 | #29 | Exceptional 20.9% |
| Immigrants from Bangladesh | 100.0 /100 | #30 | Exceptional 20.9% |
| Vietnamese | 100.0 /100 | #31 | Exceptional 21.0% |
| Immigrants from Yemen | 100.0 /100 | #32 | Exceptional 21.1% |
| Immigrants from Bahamas | 100.0 /100 | #33 | Exceptional 21.1% |
| Pima | 100.0 /100 | #34 | Exceptional 21.1% |
| Somalis | 100.0 /100 | #35 | Exceptional 21.2% |
| Belizeans | 100.0 /100 | #36 | Exceptional 21.2% |
| Immigrants from Somalia | 100.0 /100 | #37 | Exceptional 21.2% |
| Immigrants from Belize | 100.0 /100 | #38 | Exceptional 21.3% |
| Colville | 100.0 /100 | #39 | Exceptional 21.3% |
| Lumbee | 100.0 /100 | #40 | Exceptional 21.3% |
| Liberians | 100.0 /100 | #41 | Exceptional 21.4% |
| Immigrants from Sierra Leone | 100.0 /100 | #42 | Exceptional 21.4% |
| Sierra Leoneans | 100.0 /100 | #43 | Exceptional 21.4% |
Belizean Wage/Income Gap Correlation Summary
| Measurement | Belizean Data | Wage/Income Gap Data |
| Minimum | 0.018% | 1.6% |
| Maximum | 5.0% | 57.2% |
| Range | 5.0% | 55.6% |
| Mean | 1.4% | 21.8% |
| Median | 1.2% | 21.3% |
| Interquartile 25% (IQ1) | 0.56% | 16.1% |
| Interquartile 75% (IQ3) | 1.9% | 23.8% |
| Interquartile Range (IQR) | 1.3% | 7.7% |
| Standard Deviation (Sample) | 1.2% | 9.3% |
| Standard Deviation (Population) | 1.2% | 9.2% |
Correlation Details
| Belizean Percentile | Sample Size | Wage/Income Gap |
[ 0.0% - 0.5% ] 0.018% | 83,034,761 | 23.0% |
[ 0.0% - 0.5% ] 0.073% | 26,265,265 | 20.6% |
[ 0.0% - 0.5% ] 0.11% | 12,860,346 | 23.6% |
[ 0.0% - 0.5% ] 0.16% | 5,939,054 | 23.0% |
[ 0.0% - 0.5% ] 0.21% | 6,779,928 | 19.3% |
[ 0.0% - 0.5% ] 0.25% | 2,320,456 | 24.3% |
[ 0.0% - 0.5% ] 0.31% | 1,266,273 | 23.0% |
[ 0.0% - 0.5% ] 0.35% | 1,563,130 | 22.1% |
[ 0.0% - 0.5% ] 0.40% | 573,726 | 21.5% |
[ 0.0% - 0.5% ] 0.45% | 314,694 | 23.1% |
[ 0.0% - 0.5% ] 0.49% | 608,681 | 20.6% |
[ 0.5% - 1.0% ] 0.54% | 138,230 | 27.8% |
[ 0.5% - 1.0% ] 0.58% | 453,489 | 17.6% |
[ 0.5% - 1.0% ] 0.63% | 111,057 | 23.2% |
[ 0.5% - 1.0% ] 0.69% | 165,174 | 20.5% |
[ 0.5% - 1.0% ] 0.72% | 183,645 | 18.7% |
[ 0.5% - 1.0% ] 0.76% | 98,609 | 15.7% |
[ 0.5% - 1.0% ] 0.83% | 111,092 | 15.5% |
[ 0.5% - 1.0% ] 0.87% | 166,879 | 27.4% |
[ 0.5% - 1.0% ] 0.92% | 89,195 | 17.2% |
[ 0.5% - 1.0% ] 0.97% | 175,979 | 19.2% |
[ 1.0% - 1.5% ] 1.02% | 76,338 | 13.6% |
[ 1.0% - 1.5% ] 1.05% | 44,093 | 35.9% |
[ 1.0% - 1.5% ] 1.09% | 117,867 | 14.5% |
[ 1.0% - 1.5% ] 1.16% | 19,502 | 29.4% |
[ 1.0% - 1.5% ] 1.21% | 18,051 | 21.8% |
[ 1.0% - 1.5% ] 1.25% | 86,673 | 19.1% |
[ 1.0% - 1.5% ] 1.29% | 88,940 | 22.9% |
[ 1.0% - 1.5% ] 1.34% | 67,580 | 24.0% |
[ 1.0% - 1.5% ] 1.37% | 1,966 | 32.1% |
[ 1.0% - 1.5% ] 1.44% | 4,946 | 16.4% |
[ 1.5% - 2.0% ] 1.53% | 115,858 | 10.5% |
[ 1.5% - 2.0% ] 1.57% | 15,476 | 18.8% |
[ 1.5% - 2.0% ] 1.68% | 32,229 | 1.6% |
[ 1.5% - 2.0% ] 1.72% | 50,024 | 21.0% |
[ 1.5% - 2.0% ] 1.75% | 43,092 | 32.5% |
[ 1.5% - 2.0% ] 1.82% | 12,651 | 23.5% |
[ 1.5% - 2.0% ] 1.92% | 49,898 | 13.2% |
[ 2.0% - 2.5% ] 2.04% | 7,702 | 22.7% |
[ 2.0% - 2.5% ] 2.19% | 18,360 | 14.5% |
[ 2.0% - 2.5% ] 2.23% | 22,059 | 13.9% |
[ 2.0% - 2.5% ] 2.42% | 20,336 | 12.0% |
[ 2.0% - 2.5% ] 2.48% | 45,322 | 7.4% |
[ 3.0% - 3.5% ] 3.00% | 1,932 | 11.4% |
[ 3.0% - 3.5% ] 3.13% | 2,204 | 21.3% |
[ 3.0% - 3.5% ] 3.22% | 1,489 | 57.2% |
[ 4.5% - 5.0% ] 4.60% | 2,739 | 34.6% |
[ 4.5% - 5.0% ] 4.68% | 770 | 47.6% |
[ 4.5% - 5.0% ] 4.99% | 421 | 29.0% |