Japanese Wage/Income Gap

COMPARE

Japanese
Race
Ancestry
AfghanAfricanAlaska NativeAlaskan AthabascanAlbanianAleutAlsatianAmericanApacheArabArapahoArgentineanArmenianAssyrian/Chaldean/SyriacAustralianAustrianBahamianBangladeshiBarbadianBasqueBelgianBelizeanBermudanBhutaneseBlackfeetBolivianBrazilianBritishBritish West IndianBulgarianBurmeseCajunCambodianCanadianCape VerdeanCarpatho RusynCelticCentral AmericanCentral American IndianCherokeeCheyenneChickasawChileanChineseChippewaChoctawColombianColvilleComancheCosta RicanCreeCreekCroatianCrowCubanCypriotCzechCzechoslovakianDanishDelawareDominicanDutchDutch West IndianEastern EuropeanEcuadorianEgyptianEnglishEstonianEthiopianEuropeanFijianFilipinoFinnishFrenchFrench American IndianFrench CanadianGermanGerman RussianGhanaianGreekGuamanian/ChamorroGuatemalanGuyaneseHaitianHmongHonduranHopiHoumaHungarianIcelanderIndian (Asian)IndonesianInupiatIranianIraqiIrishIroquoisIsraeliItalianJamaicanJapaneseJordanianKenyanKiowaKoreanLaotianLatvianLebaneseLiberianLithuanianLumbeeLuxembourgerMacedonianMalaysianMalteseMarshalleseMenomineeMexicanMexican American IndianMongolianMoroccanNative HawaiianNavajoNepaleseNew ZealanderNicaraguanNigerianNorthern EuropeanNorwegianOkinawanOsageOttawaPaiutePakistaniPalestinianPanamanianParaguayanPennsylvania GermanPeruvianPimaPolishPortuguesePotawatomiPuebloPuerto RicanPuget Sound SalishRomanianRussianSalvadoranSamoanScandinavianScotch-IrishScottishSeminoleSenegaleseSerbianShoshoneSierra LeoneanSiouxSlavicSlovakSloveneSomaliSouth AfricanSouth AmericanSouth American IndianSoviet UnionSpaniardSpanishSpanish AmericanSpanish American IndianSri LankanSubsaharan AfricanSudaneseSwedishSwissSyrianTaiwaneseThaiTlingit-HaidaTohono O'OdhamTonganTrinidadian and TobagonianTsimshianTurkishU.S. Virgin IslanderUgandanUkrainianUruguayanUteVenezuelanVietnameseWelshWest IndianYakamaYaquiYugoslavianYumanYup'ikZimbabwean
Immigration
NonimmigrantsImmigrantsAfghanistanAfricaAlbaniaArgentinaArmeniaAsiaAustraliaAustriaBahamasBangladeshBarbadosBelarusBelgiumBelizeBoliviaBosnia and HerzegovinaBrazilBulgariaBurma/MyanmarCabo VerdeCambodiaCameroonCanadaCaribbeanCentral AmericaChileChinaColombiaCongoCosta RicaCroatiaCubaCzechoslovakiaDenmarkDominicaDominican RepublicEastern AfricaEastern AsiaEastern EuropeEcuadorEgyptEl SalvadorEnglandEritreaEthiopiaEuropeFijiFranceGermanyGhanaGreeceGrenadaGuatemalaGuyanaHaitiHondurasHong KongHungaryIndiaIndonesiaIranIraqIrelandIsraelItalyJamaicaJapanJordanKazakhstanKenyaKoreaKuwaitLaosLatin AmericaLatviaLebanonLiberiaLithuaniaMalaysiaMexicoMicronesiaMiddle AfricaMoldovaMoroccoNepalNetherlandsNicaraguaNigeriaNorth AmericaNorth MacedoniaNorthern AfricaNorthern EuropeNorwayOceaniaPakistanPanamaPeruPhilippinesPolandPortugalRomaniaRussiaSaudi ArabiaScotlandSenegalSerbiaSierra LeoneSingaporeSomaliaSouth AfricaSouth AmericaSouth Central AsiaSouth Eastern AsiaSouthern EuropeSpainSri LankaSt. Vincent and the GrenadinesSudanSwedenSwitzerlandSyriaTaiwanThailandTrinidad and TobagoTurkeyUgandaUkraineUruguayUzbekistanVenezuelaVietnamWest IndiesWestern AfricaWestern AsiaWestern EuropeYemenZaireZimbabweAzores
Select to Compare
Race
Ancestry
AfghanAfricanAlaska NativeAlaskan AthabascanAlbanianAleutAlsatianAmericanApacheArabArapahoArgentineanArmenianAssyrian/Chaldean/SyriacAustralianAustrianBahamianBangladeshiBarbadianBasqueBelgianBelizeanBermudanBhutaneseBlackfeetBolivianBrazilianBritishBritish West IndianBulgarianBurmeseCajunCambodianCanadianCape VerdeanCarpatho RusynCelticCentral AmericanCentral American IndianCherokeeCheyenneChickasawChileanChineseChippewaChoctawColombianColvilleComancheCosta RicanCreeCreekCroatianCrowCubanCypriotCzechCzechoslovakianDanishDelawareDominicanDutchDutch West IndianEastern EuropeanEcuadorianEgyptianEnglishEstonianEthiopianEuropeanFijianFilipinoFinnishFrenchFrench American IndianFrench CanadianGermanGerman RussianGhanaianGreekGuamanian/ChamorroGuatemalanGuyaneseHaitianHmongHonduranHopiHoumaHungarianIcelanderIndian (Asian)IndonesianInupiatIranianIraqiIrishIroquoisIsraeliItalianJamaicanJordanianKenyanKiowaKoreanLaotianLatvianLebaneseLiberianLithuanianLumbeeLuxembourgerMacedonianMalaysianMalteseMarshalleseMenomineeMexicanMexican American IndianMongolianMoroccanNative HawaiianNavajoNepaleseNew ZealanderNicaraguanNigerianNorthern EuropeanNorwegianOkinawanOsageOttawaPaiutePakistaniPalestinianPanamanianParaguayanPennsylvania GermanPeruvianPimaPolishPortuguesePotawatomiPuebloPuerto RicanPuget Sound SalishRomanianRussianSalvadoranSamoanScandinavianScotch-IrishScottishSeminoleSenegaleseSerbianShoshoneSierra LeoneanSiouxSlavicSlovakSloveneSomaliSouth AfricanSouth AmericanSouth American IndianSoviet UnionSpaniardSpanishSpanish AmericanSpanish American IndianSri LankanSubsaharan AfricanSudaneseSwedishSwissSyrianTaiwaneseThaiTlingit-HaidaTohono O'OdhamTonganTrinidadian and TobagonianTsimshianTurkishU.S. Virgin IslanderUgandanUkrainianUruguayanUteVenezuelanVietnameseWelshWest IndianYakamaYaquiYugoslavianYumanYup'ikZimbabwean
Immigration
NonimmigrantsImmigrantsAfghanistanAfricaAlbaniaArgentinaArmeniaAsiaAustraliaAustriaBahamasBangladeshBarbadosBelarusBelgiumBelizeBoliviaBosnia and HerzegovinaBrazilBulgariaBurma/MyanmarCabo VerdeCambodiaCameroonCanadaCaribbeanCentral AmericaChileChinaColombiaCongoCosta RicaCroatiaCubaCzechoslovakiaDenmarkDominicaDominican RepublicEastern AfricaEastern AsiaEastern EuropeEcuadorEgyptEl SalvadorEnglandEritreaEthiopiaEuropeFijiFranceGermanyGhanaGreeceGrenadaGuatemalaGuyanaHaitiHondurasHong KongHungaryIndiaIndonesiaIranIraqIrelandIsraelItalyJamaicaJapanJordanKazakhstanKenyaKoreaKuwaitLaosLatin AmericaLatviaLebanonLiberiaLithuaniaMalaysiaMexicoMicronesiaMiddle AfricaMoldovaMoroccoNepalNetherlandsNicaraguaNigeriaNorth AmericaNorth MacedoniaNorthern AfricaNorthern EuropeNorwayOceaniaPakistanPanamaPeruPhilippinesPolandPortugalRomaniaRussiaSaudi ArabiaScotlandSenegalSerbiaSierra LeoneSingaporeSomaliaSouth AfricaSouth AmericaSouth Central AsiaSouth Eastern AsiaSouthern EuropeSpainSri LankaSt. Vincent and the GrenadinesSudanSwedenSwitzerlandSyriaTaiwanThailandTrinidad and TobagoTurkeyUgandaUkraineUruguayUzbekistanVenezuelaVietnamWest IndiesWestern AfricaWestern AsiaWestern EuropeYemenZaireZimbabweAzores
Wage/Income Gap
Income
Poverty
Unemployment
Labor Participation
Family Structure
Vehicle Availability
Education Level
Disability

Japanese Wage/Income Gap
Exceptional

23.8%
WAGE/INCOME GAP
99.1/ 100
METRIC RATING
101st/ 347
METRIC RANK

Japanese Wage/Income Gap Correlation Chart

The statistical analysis conducted on geographies consisting of 249,130,971 people shows a moderate positive correlation between the proportion of Japanese and wage/income gap percentage in the United States with a correlation coefficient (R) of 0.440 and weighted average of 23.8%. On average, for every 1% (one percent) increase in Japanese within a typical geography, there is an increase of 0.81% in wage/income gap percentage.
Japanese Wage/Income Gap
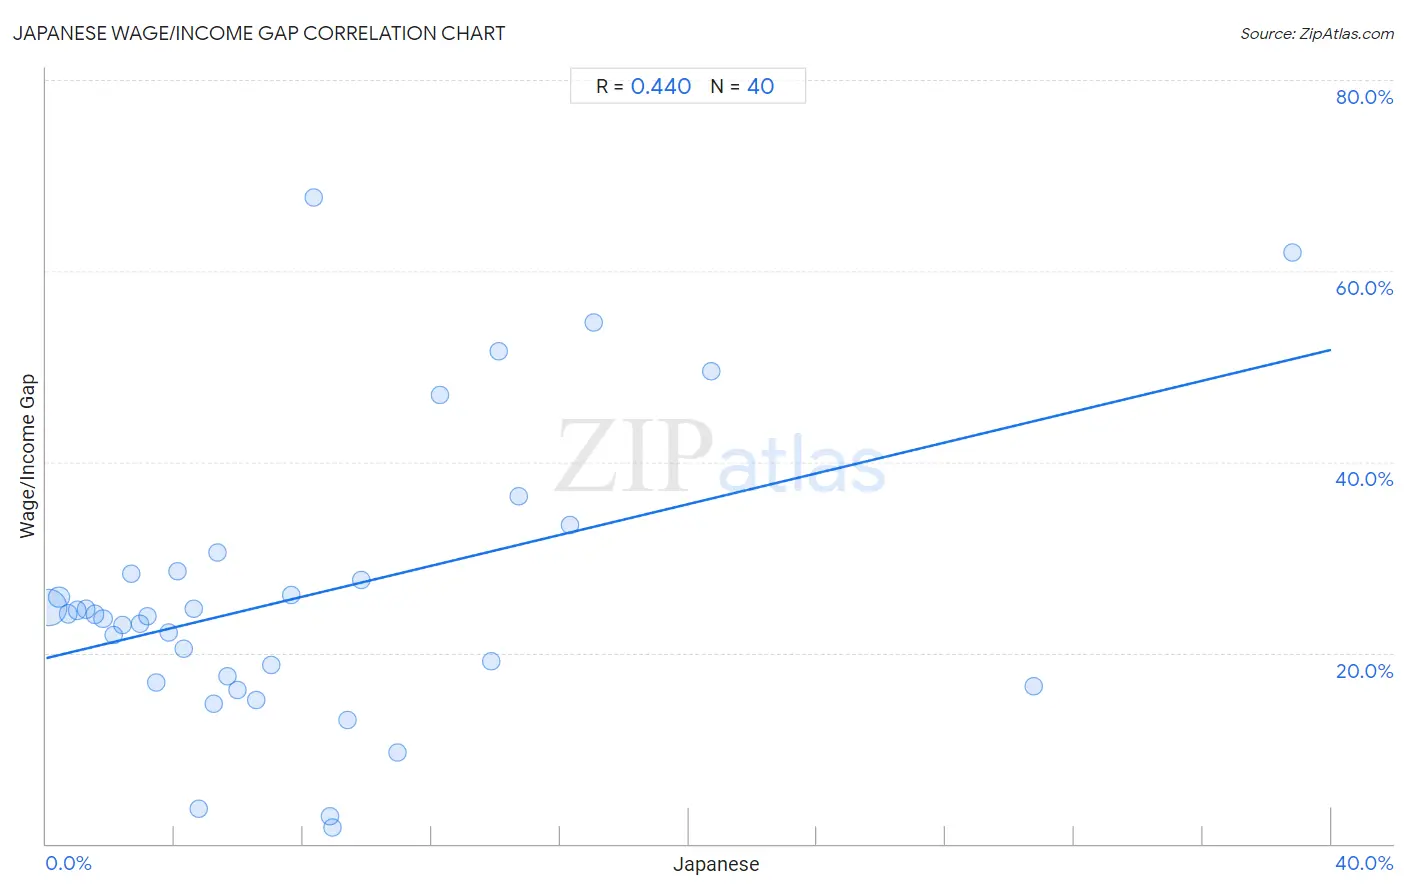
It is essential to understand that the correlation between the percentage of Japanese and wage/income gap percentage does not imply a direct cause-and-effect relationship. It remains uncertain whether the presence of Japanese influences an upward or downward trend in the level of wage/income gap percentage within an area, or if Japanese simply ended up residing in those areas with higher or lower levels of wage/income gap percentage due to other factors.

Demographics Similar to Japanese by Wage/Income Gap

In terms of wage/income gap, the demographic groups most similar to Japanese are Immigrants from Laos (23.8%, a difference of 0.14%), Yakama (23.7%, a difference of 0.15%), Aleut (23.7%, a difference of 0.17%), Immigrants from Latin America (23.7%, a difference of 0.25%), and Tsimshian (23.9%, a difference of 0.37%).
DemographicsRating | RankWage/Income Gap
Hondurans
99.5
/100
|
#94
Exceptional
23.6%
Cape Verdeans
99.4
/100
|
#95
Exceptional
23.6%
Kiowa
99.4
/100
|
#96
Exceptional
23.6%
Immigrants from Sudan
99.4
/100
|
#97
Exceptional
23.6%
Immigrants from Latin America
99.2
/100
|
#98
Exceptional
23.7%
Aleuts
99.2
/100
|
#99
Exceptional
23.7%
Yakama
99.2
/100
|
#100
Exceptional
23.7%
Japanese
99.1
/100
|
#101
Exceptional
23.8%
Immigrants from Laos
99.0
/100
|
#102
Exceptional
23.8%
Tsimshian
98.9
/100
|
#103
Exceptional
23.9%
Tlingit-Haida
98.7
/100
|
#104
Exceptional
24.0%
Moroccans
98.6
/100
|
#105
Exceptional
24.0%
Sudanese
98.6
/100
|
#106
Exceptional
24.0%
Yaqui
98.4
/100
|
#107
Exceptional
24.0%
Immigrants from Albania
98.4
/100
|
#108
Exceptional
24.0%

Japanese Wage/Income Gap Correlation Summary

MeasurementJapanese DataWage/Income Gap Data
Minimum0.089%1.7%
Maximum38.8%67.8%
Range38.7%66.0%
Mean8.1%26.0%
Median5.5%23.9%
Interquartile 25% (IQ1)2.8%17.2%
Interquartile 75% (IQ3)10.4%28.4%
Interquartile Range (IQR)7.6%11.2%
Standard Deviation (Sample)8.1%14.8%
Standard Deviation (Population)8.0%14.6%

Correlation Details

Japanese PercentileSample SizeWage/Income Gap
[
0.0%
-
0.5%
]
0.089%
191,225,21624.7%
[
0.0%
-
0.5%
]
0.39%
32,051,53125.8%
[
0.5%
-
1.0%
]
0.68%
11,051,83324.1%
[
0.5%
-
1.0%
]
0.95%
5,585,94124.5%
[
1.0%
-
1.5%
]
1.23%
2,875,02724.6%
[
1.5%
-
2.0%
]
1.51%
1,546,80724.0%
[
1.5%
-
2.0%
]
1.77%
1,264,88323.6%
[
2.0%
-
2.5%
]
2.09%
537,39221.9%
[
2.0%
-
2.5%
]
2.37%
401,59622.9%
[
2.5%
-
3.0%
]
2.63%
78,96928.3%
[
2.5%
-
3.0%
]
2.93%
183,15223.0%
[
3.0%
-
3.5%
]
3.15%
208,25623.8%
[
3.0%
-
3.5%
]
3.43%
147,54516.9%
[
3.5%
-
4.0%
]
3.81%
634,52722.1%
[
4.0%
-
4.5%
]
4.08%
59,57528.5%
[
4.0%
-
4.5%
]
4.30%
473,88220.4%
[
4.5%
-
5.0%
]
4.57%
68,00824.6%
[
4.5%
-
5.0%
]
4.73%
74,6953.6%
[
5.0%
-
5.5%
]
5.21%
41,24014.7%
[
5.0%
-
5.5%
]
5.33%
3,33930.5%
[
5.5%
-
6.0%
]
5.64%
103,42117.5%
[
5.5%
-
6.0%
]
5.96%
70,20216.1%
[
6.5%
-
7.0%
]
6.54%
65,60815.1%
[
6.5%
-
7.0%
]
6.99%
41,00118.7%
[
7.5%
-
8.0%
]
7.63%
59,15326.1%
[
8.0%
-
8.5%
]
8.32%
1,77867.8%
[
8.5%
-
9.0%
]
8.84%
12,3242.8%
[
8.5%
-
9.0%
]
8.91%
11,6781.7%
[
9.0%
-
9.5%
]
9.38%
2,91113.0%
[
9.5%
-
10.0%
]
9.81%
59,46027.6%
[
10.5%
-
11.0%
]
10.92%
27,8489.5%
[
12.0%
-
12.5%
]
12.25%
2,58847.0%
[
13.5%
-
14.0%
]
13.86%
114,73719.1%
[
14.0%
-
14.5%
]
14.08%
98751.6%
[
14.5%
-
15.0%
]
14.72%
2,21536.3%
[
16.0%
-
16.5%
]
16.30%
41133.3%
[
17.0%
-
17.5%
]
17.03%
7,11854.6%
[
20.5%
-
21.0%
]
20.70%
1,57549.5%
[
30.5%
-
31.0%
]
30.73%
32,32316.5%
[
38.5%
-
39.0%
]
38.81%
21961.9%