Immigrants from Guyana Wage/Income Gap
COMPARE
Immigrants from Guyana
Select to Compare
Wage/Income Gap
Immigrants from Guyana Wage/Income Gap
18.4%
WAGE/INCOME GAP
100.0/ 100
METRIC RATING
6th/ 347
METRIC RANK
Immigrants from Guyana Wage/Income Gap Correlation Chart
The statistical analysis conducted on geographies consisting of 183,675,272 people shows a poor negative correlation between the proportion of Immigrants from Guyana and wage/income gap percentage in the United States with a correlation coefficient (R) of -0.164 and weighted average of 18.4%. On average, for every 1% (one percent) increase in Immigrants from Guyana within a typical geography, there is a decrease of 0.30% in wage/income gap percentage.
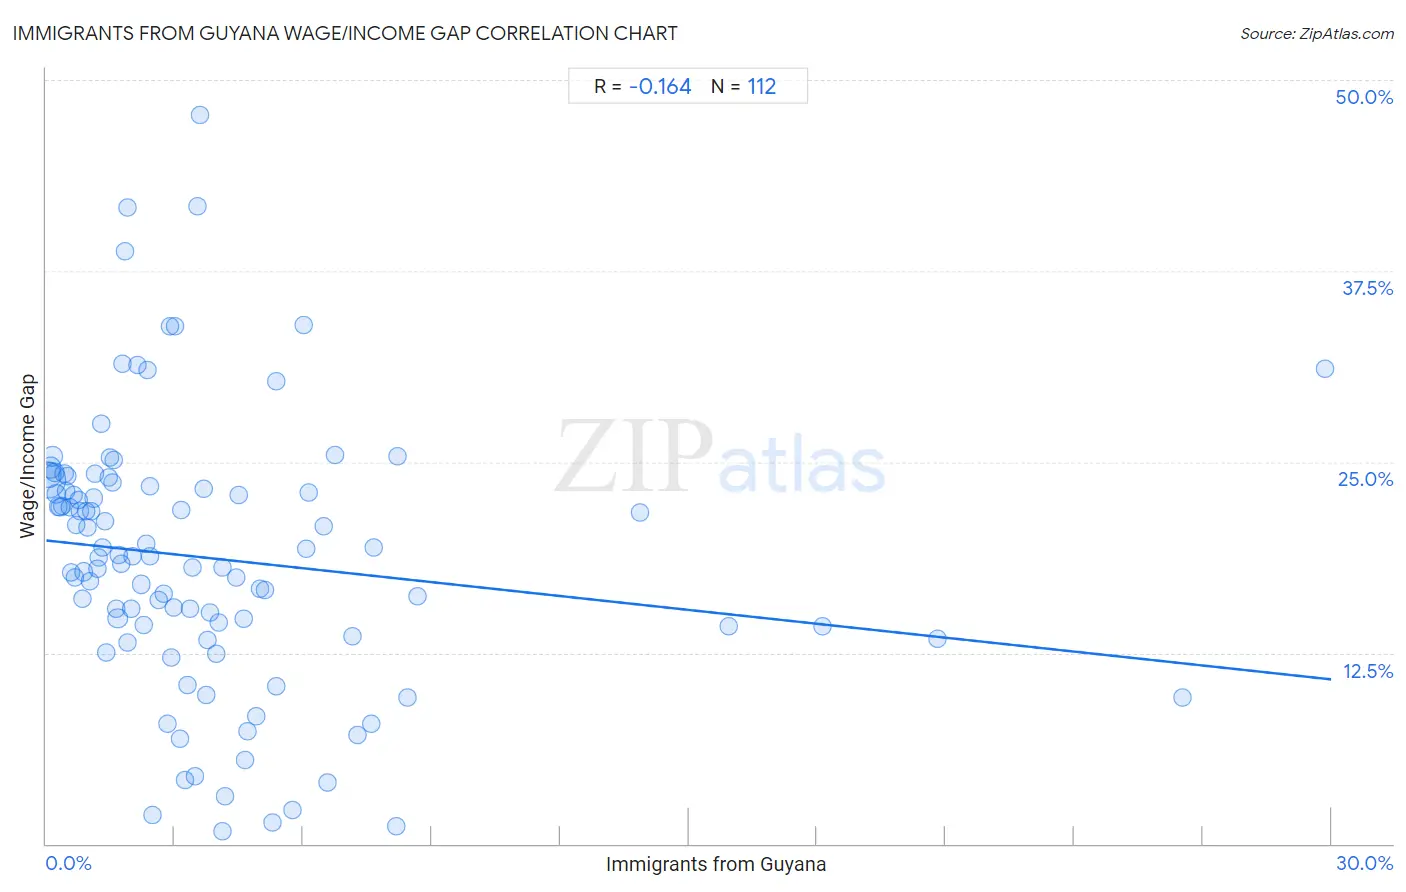
It is essential to understand that the correlation between the percentage of Immigrants from Guyana and wage/income gap percentage does not imply a direct cause-and-effect relationship. It remains uncertain whether the presence of Immigrants from Guyana influences an upward or downward trend in the level of wage/income gap percentage within an area, or if Immigrants from Guyana simply ended up residing in those areas with higher or lower levels of wage/income gap percentage due to other factors.
Demographics Similar to Immigrants from Guyana by Wage/Income Gap
In terms of wage/income gap, the demographic groups most similar to Immigrants from Guyana are Guyanese (18.3%, a difference of 0.26%), British West Indian (18.0%, a difference of 1.9%), Puerto Rican (18.7%, a difference of 2.0%), Immigrants from Jamaica (18.8%, a difference of 2.6%), and Immigrants from Barbados (17.8%, a difference of 2.9%).
| Demographics | Rating | Rank | Wage/Income Gap |
| Immigrants from Grenada | 100.0 /100 | #1 | Exceptional 16.2% |
| Immigrants from St. Vincent and the Grenadines | 100.0 /100 | #2 | Exceptional 16.4% |
| Immigrants from Barbados | 100.0 /100 | #3 | Exceptional 17.8% |
| British West Indians | 100.0 /100 | #4 | Exceptional 18.0% |
| Guyanese | 100.0 /100 | #5 | Exceptional 18.3% |
| Immigrants from Guyana | 100.0 /100 | #6 | Exceptional 18.4% |
| Puerto Ricans | 100.0 /100 | #7 | Exceptional 18.7% |
| Immigrants from Jamaica | 100.0 /100 | #8 | Exceptional 18.8% |
| Barbadians | 100.0 /100 | #9 | Exceptional 19.0% |
| Crow | 100.0 /100 | #10 | Exceptional 19.1% |
| Immigrants from Haiti | 100.0 /100 | #11 | Exceptional 19.2% |
| Immigrants from West Indies | 100.0 /100 | #12 | Exceptional 19.2% |
| Trinidadians and Tobagonians | 100.0 /100 | #13 | Exceptional 19.3% |
| Immigrants from Trinidad and Tobago | 100.0 /100 | #14 | Exceptional 19.3% |
| West Indians | 100.0 /100 | #15 | Exceptional 19.6% |
Immigrants from Guyana Wage/Income Gap Correlation Summary
| Measurement | Immigrants from Guyana Data | Wage/Income Gap Data |
| Minimum | 0.017% | 0.78% |
| Maximum | 29.8% | 47.7% |
| Range | 29.8% | 46.9% |
| Mean | 3.9% | 18.7% |
| Median | 2.7% | 18.8% |
| Interquartile 25% (IQ1) | 1.2% | 13.9% |
| Interquartile 75% (IQ3) | 4.7% | 23.4% |
| Interquartile Range (IQR) | 3.4% | 9.4% |
| Standard Deviation (Sample) | 4.8% | 8.8% |
| Standard Deviation (Population) | 4.8% | 8.8% |
Correlation Details
| Immigrants from Guyana Percentile | Sample Size | Wage/Income Gap |
[ 0.0% - 0.5% ] 0.017% | 79,496,090 | 23.8% |
[ 0.0% - 0.5% ] 0.063% | 31,773,713 | 24.1% |
[ 0.0% - 0.5% ] 0.11% | 14,444,476 | 24.6% |
[ 0.0% - 0.5% ] 0.15% | 9,949,501 | 25.4% |
[ 0.0% - 0.5% ] 0.19% | 6,442,355 | 24.3% |
[ 0.0% - 0.5% ] 0.24% | 4,623,040 | 22.9% |
[ 0.0% - 0.5% ] 0.28% | 3,869,536 | 22.1% |
[ 0.0% - 0.5% ] 0.32% | 3,071,201 | 22.0% |
[ 0.0% - 0.5% ] 0.37% | 2,154,223 | 22.1% |
[ 0.0% - 0.5% ] 0.41% | 2,015,173 | 24.2% |
[ 0.0% - 0.5% ] 0.46% | 1,317,524 | 23.1% |
[ 0.0% - 0.5% ] 0.50% | 1,443,899 | 24.1% |
[ 0.5% - 1.0% ] 0.54% | 1,696,928 | 22.0% |
[ 0.5% - 1.0% ] 0.58% | 945,390 | 17.8% |
[ 0.5% - 1.0% ] 0.63% | 906,711 | 22.8% |
[ 0.5% - 1.0% ] 0.67% | 787,529 | 17.5% |
[ 0.5% - 1.0% ] 0.71% | 548,581 | 20.9% |
[ 0.5% - 1.0% ] 0.75% | 500,308 | 22.5% |
[ 0.5% - 1.0% ] 0.80% | 698,314 | 21.8% |
[ 0.5% - 1.0% ] 0.85% | 371,701 | 16.0% |
[ 0.5% - 1.0% ] 0.88% | 606,777 | 17.8% |
[ 0.5% - 1.0% ] 0.94% | 639,760 | 21.8% |
[ 0.5% - 1.0% ] 0.97% | 416,003 | 20.7% |
[ 1.0% - 1.5% ] 1.01% | 459,823 | 17.2% |
[ 1.0% - 1.5% ] 1.05% | 175,189 | 21.8% |
[ 1.0% - 1.5% ] 1.11% | 481,030 | 22.6% |
[ 1.0% - 1.5% ] 1.15% | 240,669 | 24.2% |
[ 1.0% - 1.5% ] 1.20% | 260,155 | 18.0% |
[ 1.0% - 1.5% ] 1.24% | 299,100 | 18.8% |
[ 1.0% - 1.5% ] 1.29% | 184,197 | 27.5% |
[ 1.0% - 1.5% ] 1.32% | 118,162 | 19.4% |
[ 1.0% - 1.5% ] 1.37% | 169,098 | 21.1% |
[ 1.0% - 1.5% ] 1.41% | 31,132 | 12.6% |
[ 1.0% - 1.5% ] 1.45% | 128,480 | 24.0% |
[ 1.0% - 1.5% ] 1.49% | 116,733 | 25.3% |
[ 1.5% - 2.0% ] 1.54% | 98,754 | 23.7% |
[ 1.5% - 2.0% ] 1.59% | 100,368 | 25.2% |
[ 1.5% - 2.0% ] 1.63% | 95,034 | 15.4% |
[ 1.5% - 2.0% ] 1.67% | 8,678,958 | 14.7% |
[ 1.5% - 2.0% ] 1.70% | 17,453 | 18.9% |
[ 1.5% - 2.0% ] 1.76% | 38,261 | 18.3% |
[ 1.5% - 2.0% ] 1.79% | 39,833 | 31.4% |
[ 1.5% - 2.0% ] 1.85% | 10,277 | 38.8% |
[ 1.5% - 2.0% ] 1.89% | 9,572 | 41.6% |
[ 1.5% - 2.0% ] 1.91% | 8,592 | 13.1% |
[ 1.5% - 2.0% ] 1.98% | 50,700 | 15.4% |
[ 2.0% - 2.5% ] 2.01% | 62,566 | 18.8% |
[ 2.0% - 2.5% ] 2.13% | 11,841 | 31.3% |
[ 2.0% - 2.5% ] 2.22% | 99,500 | 17.0% |
[ 2.0% - 2.5% ] 2.28% | 163,473 | 14.3% |
[ 2.0% - 2.5% ] 2.32% | 126,582 | 19.7% |
[ 2.0% - 2.5% ] 2.35% | 47,058 | 31.0% |
[ 2.0% - 2.5% ] 2.41% | 8,590 | 18.8% |
[ 2.0% - 2.5% ] 2.44% | 23,072 | 23.4% |
[ 2.0% - 2.5% ] 2.48% | 2,096 | 1.9% |
[ 2.5% - 3.0% ] 2.61% | 72,881 | 15.9% |
[ 2.5% - 3.0% ] 2.73% | 2,453 | 16.4% |
[ 2.5% - 3.0% ] 2.84% | 185,343 | 7.9% |
[ 2.5% - 3.0% ] 2.90% | 60,351 | 33.9% |
[ 2.5% - 3.0% ] 2.92% | 14,937 | 12.2% |
[ 2.5% - 3.0% ] 2.97% | 113,334 | 15.5% |
[ 3.0% - 3.5% ] 3.01% | 24,584 | 33.8% |
[ 3.0% - 3.5% ] 3.12% | 8,128 | 6.9% |
[ 3.0% - 3.5% ] 3.16% | 71,894 | 21.9% |
[ 3.0% - 3.5% ] 3.25% | 7,653 | 4.2% |
[ 3.0% - 3.5% ] 3.30% | 41,633 | 10.4% |
[ 3.0% - 3.5% ] 3.36% | 44,527 | 15.4% |
[ 3.0% - 3.5% ] 3.41% | 103,664 | 18.1% |
[ 3.0% - 3.5% ] 3.48% | 41,552 | 4.4% |
[ 3.5% - 4.0% ] 3.54% | 4,006 | 41.7% |
[ 3.5% - 4.0% ] 3.59% | 3,568 | 47.7% |
[ 3.5% - 4.0% ] 3.69% | 1,951 | 23.3% |
[ 3.5% - 4.0% ] 3.74% | 34,406 | 9.7% |
[ 3.5% - 4.0% ] 3.77% | 92,588 | 13.3% |
[ 3.5% - 4.0% ] 3.83% | 14,793 | 15.2% |
[ 3.5% - 4.0% ] 3.97% | 1,790 | 12.5% |
[ 4.0% - 4.5% ] 4.02% | 96,801 | 14.5% |
[ 4.0% - 4.5% ] 4.11% | 5,164 | 0.78% |
[ 4.0% - 4.5% ] 4.12% | 14,287 | 18.1% |
[ 4.0% - 4.5% ] 4.18% | 43,014 | 3.1% |
[ 4.0% - 4.5% ] 4.42% | 30,290 | 17.4% |
[ 4.0% - 4.5% ] 4.48% | 218,639 | 22.8% |
[ 4.5% - 5.0% ] 4.60% | 5,938 | 14.8% |
[ 4.5% - 5.0% ] 4.64% | 100,082 | 5.5% |
[ 4.5% - 5.0% ] 4.69% | 135,422 | 7.4% |
[ 4.5% - 5.0% ] 4.91% | 21,329 | 8.4% |
[ 4.5% - 5.0% ] 4.99% | 108,470 | 16.7% |
[ 5.0% - 5.5% ] 5.12% | 15,459 | 16.6% |
[ 5.0% - 5.5% ] 5.30% | 44,832 | 1.4% |
[ 5.0% - 5.5% ] 5.37% | 22,770 | 30.3% |
[ 5.0% - 5.5% ] 5.37% | 29,216 | 10.3% |
[ 5.5% - 6.0% ] 5.74% | 27,845 | 2.2% |
[ 6.0% - 6.5% ] 6.02% | 1,179 | 34.0% |
[ 6.0% - 6.5% ] 6.07% | 25,187 | 19.3% |
[ 6.0% - 6.5% ] 6.13% | 14,367 | 23.0% |
[ 6.0% - 6.5% ] 6.47% | 108,180 | 20.8% |
[ 6.5% - 7.0% ] 6.56% | 78,506 | 4.0% |
[ 6.5% - 7.0% ] 6.74% | 2,135 | 25.4% |
[ 7.0% - 7.5% ] 7.15% | 21,901 | 13.6% |
[ 7.0% - 7.5% ] 7.27% | 38,317 | 7.1% |
[ 7.5% - 8.0% ] 7.59% | 40,593 | 7.9% |
[ 7.5% - 8.0% ] 7.64% | 59,961 | 19.4% |
[ 8.0% - 8.5% ] 8.16% | 38,865 | 1.1% |
[ 8.0% - 8.5% ] 8.19% | 31,200 | 25.4% |
[ 8.0% - 8.5% ] 8.44% | 27,794 | 9.6% |
[ 8.5% - 9.0% ] 8.66% | 68,476 | 16.2% |
[ 13.5% - 14.0% ] 13.87% | 29,921 | 21.7% |
[ 15.5% - 16.0% ] 15.94% | 19,554 | 14.2% |
[ 18.0% - 18.5% ] 18.13% | 21,349 | 14.2% |
[ 20.5% - 21.0% ] 20.81% | 7,863 | 13.4% |
[ 26.5% - 27.0% ] 26.52% | 51,153 | 9.5% |
[ 29.5% - 30.0% ] 29.84% | 48,096 | 31.1% |