Immigrants from Egypt Wage/Income Gap

COMPARE

Immigrants from Egypt
Race
Ancestry
AfghanAfricanAlaska NativeAlaskan AthabascanAlbanianAleutAlsatianAmericanApacheArabArapahoArgentineanArmenianAssyrian/Chaldean/SyriacAustralianAustrianBahamianBangladeshiBarbadianBasqueBelgianBelizeanBermudanBhutaneseBlackfeetBolivianBrazilianBritishBritish West IndianBulgarianBurmeseCajunCambodianCanadianCape VerdeanCarpatho RusynCelticCentral AmericanCentral American IndianCherokeeCheyenneChickasawChileanChineseChippewaChoctawColombianColvilleComancheCosta RicanCreeCreekCroatianCrowCubanCypriotCzechCzechoslovakianDanishDelawareDominicanDutchDutch West IndianEastern EuropeanEcuadorianEgyptianEnglishEstonianEthiopianEuropeanFijianFilipinoFinnishFrenchFrench American IndianFrench CanadianGermanGerman RussianGhanaianGreekGuamanian/ChamorroGuatemalanGuyaneseHaitianHmongHonduranHopiHoumaHungarianIcelanderIndian (Asian)IndonesianInupiatIranianIraqiIrishIroquoisIsraeliItalianJamaicanJapaneseJordanianKenyanKiowaKoreanLaotianLatvianLebaneseLiberianLithuanianLumbeeLuxembourgerMacedonianMalaysianMalteseMarshalleseMenomineeMexicanMexican American IndianMongolianMoroccanNative HawaiianNavajoNepaleseNew ZealanderNicaraguanNigerianNorthern EuropeanNorwegianOkinawanOsageOttawaPaiutePakistaniPalestinianPanamanianParaguayanPennsylvania GermanPeruvianPimaPolishPortuguesePotawatomiPuebloPuerto RicanPuget Sound SalishRomanianRussianSalvadoranSamoanScandinavianScotch-IrishScottishSeminoleSenegaleseSerbianShoshoneSierra LeoneanSiouxSlavicSlovakSloveneSomaliSouth AfricanSouth AmericanSouth American IndianSoviet UnionSpaniardSpanishSpanish AmericanSpanish American IndianSri LankanSubsaharan AfricanSudaneseSwedishSwissSyrianTaiwaneseThaiTlingit-HaidaTohono O'OdhamTonganTrinidadian and TobagonianTsimshianTurkishU.S. Virgin IslanderUgandanUkrainianUruguayanUteVenezuelanVietnameseWelshWest IndianYakamaYaquiYugoslavianYumanYup'ikZimbabwean
Immigration
NonimmigrantsImmigrantsAfghanistanAfricaAlbaniaArgentinaArmeniaAsiaAustraliaAustriaBahamasBangladeshBarbadosBelarusBelgiumBelizeBoliviaBosnia and HerzegovinaBrazilBulgariaBurma/MyanmarCabo VerdeCambodiaCameroonCanadaCaribbeanCentral AmericaChileChinaColombiaCongoCosta RicaCroatiaCubaCzechoslovakiaDenmarkDominicaDominican RepublicEastern AfricaEastern AsiaEastern EuropeEcuadorEgyptEl SalvadorEnglandEritreaEthiopiaEuropeFijiFranceGermanyGhanaGreeceGrenadaGuatemalaGuyanaHaitiHondurasHong KongHungaryIndiaIndonesiaIranIraqIrelandIsraelItalyJamaicaJapanJordanKazakhstanKenyaKoreaKuwaitLaosLatin AmericaLatviaLebanonLiberiaLithuaniaMalaysiaMexicoMicronesiaMiddle AfricaMoldovaMoroccoNepalNetherlandsNicaraguaNigeriaNorth AmericaNorth MacedoniaNorthern AfricaNorthern EuropeNorwayOceaniaPakistanPanamaPeruPhilippinesPolandPortugalRomaniaRussiaSaudi ArabiaScotlandSenegalSerbiaSierra LeoneSingaporeSomaliaSouth AfricaSouth AmericaSouth Central AsiaSouth Eastern AsiaSouthern EuropeSpainSri LankaSt. Vincent and the GrenadinesSudanSwedenSwitzerlandSyriaTaiwanThailandTrinidad and TobagoTurkeyUgandaUkraineUruguayUzbekistanVenezuelaVietnamWest IndiesWestern AfricaWestern AsiaWestern EuropeYemenZaireZimbabweAzores
Select to Compare
Race
Ancestry
AfghanAfricanAlaska NativeAlaskan AthabascanAlbanianAleutAlsatianAmericanApacheArabArapahoArgentineanArmenianAssyrian/Chaldean/SyriacAustralianAustrianBahamianBangladeshiBarbadianBasqueBelgianBelizeanBermudanBhutaneseBlackfeetBolivianBrazilianBritishBritish West IndianBulgarianBurmeseCajunCambodianCanadianCape VerdeanCarpatho RusynCelticCentral AmericanCentral American IndianCherokeeCheyenneChickasawChileanChineseChippewaChoctawColombianColvilleComancheCosta RicanCreeCreekCroatianCrowCubanCypriotCzechCzechoslovakianDanishDelawareDominicanDutchDutch West IndianEastern EuropeanEcuadorianEgyptianEnglishEstonianEthiopianEuropeanFijianFilipinoFinnishFrenchFrench American IndianFrench CanadianGermanGerman RussianGhanaianGreekGuamanian/ChamorroGuatemalanGuyaneseHaitianHmongHonduranHopiHoumaHungarianIcelanderIndian (Asian)IndonesianInupiatIranianIraqiIrishIroquoisIsraeliItalianJamaicanJapaneseJordanianKenyanKiowaKoreanLaotianLatvianLebaneseLiberianLithuanianLumbeeLuxembourgerMacedonianMalaysianMalteseMarshalleseMenomineeMexicanMexican American IndianMongolianMoroccanNative HawaiianNavajoNepaleseNew ZealanderNicaraguanNigerianNorthern EuropeanNorwegianOkinawanOsageOttawaPaiutePakistaniPalestinianPanamanianParaguayanPennsylvania GermanPeruvianPimaPolishPortuguesePotawatomiPuebloPuerto RicanPuget Sound SalishRomanianRussianSalvadoranSamoanScandinavianScotch-IrishScottishSeminoleSenegaleseSerbianShoshoneSierra LeoneanSiouxSlavicSlovakSloveneSomaliSouth AfricanSouth AmericanSouth American IndianSoviet UnionSpaniardSpanishSpanish AmericanSpanish American IndianSri LankanSubsaharan AfricanSudaneseSwedishSwissSyrianTaiwaneseThaiTlingit-HaidaTohono O'OdhamTonganTrinidadian and TobagonianTsimshianTurkishU.S. Virgin IslanderUgandanUkrainianUruguayanUteVenezuelanVietnameseWelshWest IndianYakamaYaquiYugoslavianYumanYup'ikZimbabwean
Immigration
NonimmigrantsImmigrantsAfghanistanAfricaAlbaniaArgentinaArmeniaAsiaAustraliaAustriaBahamasBangladeshBarbadosBelarusBelgiumBelizeBoliviaBosnia and HerzegovinaBrazilBulgariaBurma/MyanmarCabo VerdeCambodiaCameroonCanadaCaribbeanCentral AmericaChileChinaColombiaCongoCosta RicaCroatiaCubaCzechoslovakiaDenmarkDominicaDominican RepublicEastern AfricaEastern AsiaEastern EuropeEcuadorEl SalvadorEnglandEritreaEthiopiaEuropeFijiFranceGermanyGhanaGreeceGrenadaGuatemalaGuyanaHaitiHondurasHong KongHungaryIndiaIndonesiaIranIraqIrelandIsraelItalyJamaicaJapanJordanKazakhstanKenyaKoreaKuwaitLaosLatin AmericaLatviaLebanonLiberiaLithuaniaMalaysiaMexicoMicronesiaMiddle AfricaMoldovaMoroccoNepalNetherlandsNicaraguaNigeriaNorth AmericaNorth MacedoniaNorthern AfricaNorthern EuropeNorwayOceaniaPakistanPanamaPeruPhilippinesPolandPortugalRomaniaRussiaSaudi ArabiaScotlandSenegalSerbiaSierra LeoneSingaporeSomaliaSouth AfricaSouth AmericaSouth Central AsiaSouth Eastern AsiaSouthern EuropeSpainSri LankaSt. Vincent and the GrenadinesSudanSwedenSwitzerlandSyriaTaiwanThailandTrinidad and TobagoTurkeyUgandaUkraineUruguayUzbekistanVenezuelaVietnamWest IndiesWestern AfricaWestern AsiaWestern EuropeYemenZaireZimbabweAzores
Wage/Income Gap
Income
Poverty
Unemployment
Labor Participation
Family Structure
Vehicle Availability
Education Level
Disability

Immigrants from Egypt Wage/Income Gap
Fair

26.1%
WAGE/INCOME GAP
29.9/ 100
METRIC RATING
188th/ 347
METRIC RANK

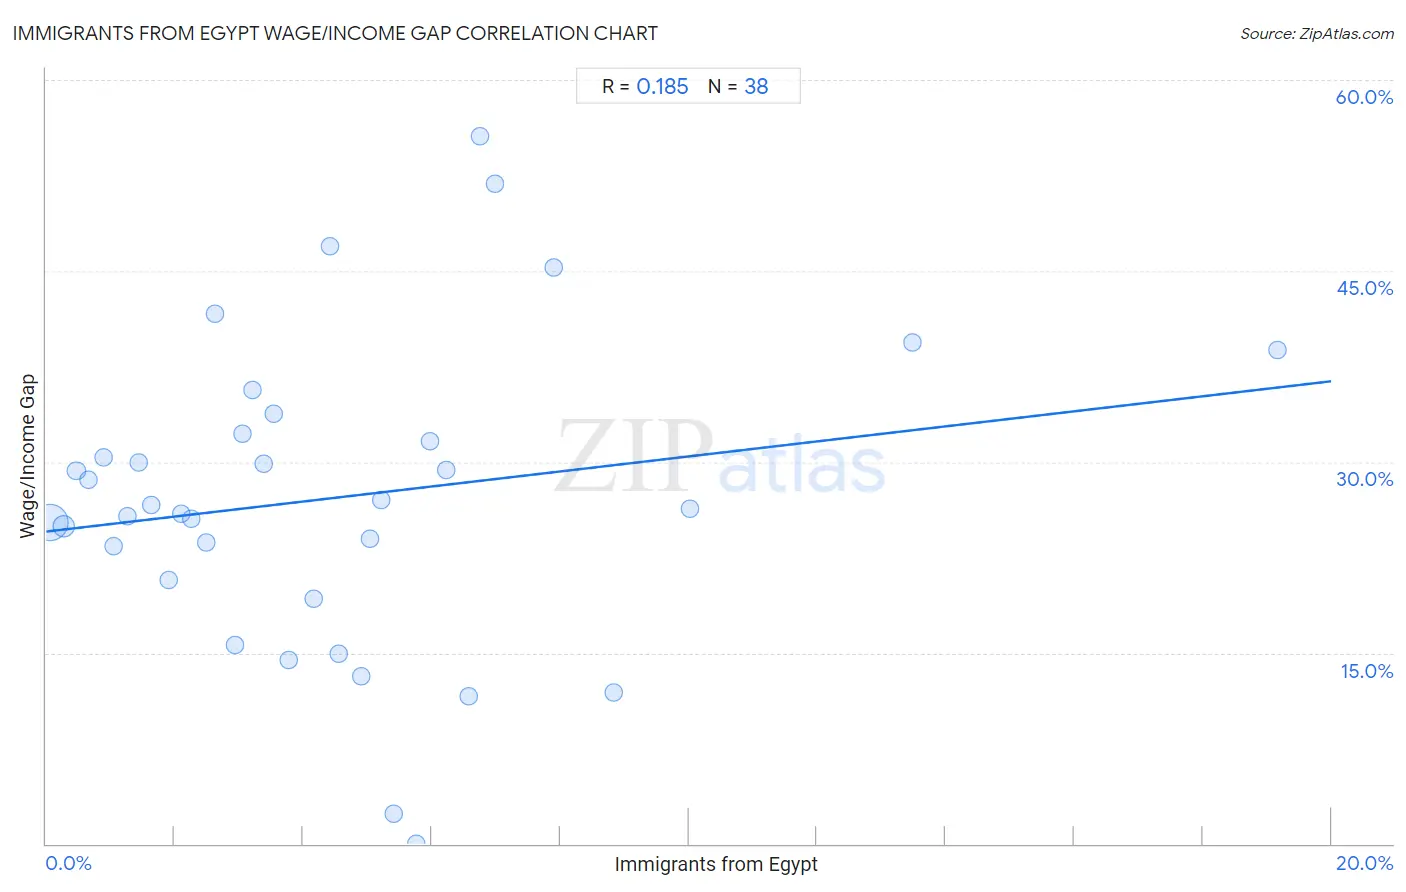
Immigrants from Egypt Wage/Income Gap Correlation Chart

The statistical analysis conducted on geographies consisting of 245,435,897 people shows a poor positive correlation between the proportion of Immigrants from Egypt and wage/income gap percentage in the United States with a correlation coefficient (R) of 0.185 and weighted average of 26.1%. On average, for every 1% (one percent) increase in Immigrants from Egypt within a typical geography, there is an increase of 0.59% in wage/income gap percentage.
Immigrants from Egypt Wage/Income Gap
It is essential to understand that the correlation between the percentage of Immigrants from Egypt and wage/income gap percentage does not imply a direct cause-and-effect relationship. It remains uncertain whether the presence of Immigrants from Egypt influences an upward or downward trend in the level of wage/income gap percentage within an area, or if Immigrants from Egypt simply ended up residing in those areas with higher or lower levels of wage/income gap percentage due to other factors.

Demographics Similar to Immigrants from Egypt by Wage/Income Gap

In terms of wage/income gap, the demographic groups most similar to Immigrants from Egypt are Palestinian (26.1%, a difference of 0.010%), Immigrants from Indonesia (26.1%, a difference of 0.20%), Immigrants from Moldova (26.2%, a difference of 0.26%), Pakistani (26.1%, a difference of 0.29%), and Mexican (26.0%, a difference of 0.34%).
DemographicsRating | RankWage/Income Gap
Immigrants from Bolivia
36.4
/100
|
#181
Fair
26.0%
Immigrants from Serbia
35.4
/100
|
#182
Fair
26.0%
Immigrants from Kazakhstan
35.2
/100
|
#183
Fair
26.0%
Mexicans
34.4
/100
|
#184
Fair
26.0%
Pakistanis
33.7
/100
|
#185
Fair
26.1%
Immigrants from Indonesia
32.5
/100
|
#186
Fair
26.1%
Palestinians
29.9
/100
|
#187
Fair
26.1%
Immigrants from Egypt
29.9
/100
|
#188
Fair
26.1%
Immigrants from Moldova
26.6
/100
|
#189
Fair
26.2%
Immigrants from Croatia
24.8
/100
|
#190
Fair
26.2%
Immigrants from Venezuela
24.7
/100
|
#191
Fair
26.2%
Immigrants from Bulgaria
22.5
/100
|
#192
Fair
26.3%
Immigrants from Jordan
22.4
/100
|
#193
Fair
26.3%
Chileans
22.3
/100
|
#194
Fair
26.3%
Immigrants from Malaysia
22.2
/100
|
#195
Fair
26.3%

Immigrants from Egypt Wage/Income Gap Correlation Summary

MeasurementImmigrants from Egypt DataWage/Income Gap Data
Minimum0.064%0.012%
Maximum19.2%55.6%
Range19.1%55.5%
Mean4.5%27.2%
Median3.7%26.5%
Interquartile 25% (IQ1)1.9%20.8%
Interquartile 75% (IQ3)6.0%32.2%
Interquartile Range (IQR)4.1%11.4%
Standard Deviation (Sample)3.8%12.1%
Standard Deviation (Population)3.8%12.0%

Correlation Details

Immigrants from Egypt PercentileSample SizeWage/Income Gap
[
0.0%
-
0.5%
]
0.064%
186,664,89925.2%
[
0.0%
-
0.5%
]
0.27%
37,100,84224.9%
[
0.0%
-
0.5%
]
0.48%
9,159,45629.3%
[
0.5%
-
1.0%
]
0.66%
4,504,06028.6%
[
0.5%
-
1.0%
]
0.89%
2,435,56930.4%
[
1.0%
-
1.5%
]
1.05%
2,224,96323.4%
[
1.0%
-
1.5%
]
1.26%
877,61725.7%
[
1.0%
-
1.5%
]
1.45%
473,38130.0%
[
1.5%
-
2.0%
]
1.63%
519,84926.6%
[
1.5%
-
2.0%
]
1.91%
496,90220.8%
[
2.0%
-
2.5%
]
2.10%
267,76725.9%
[
2.0%
-
2.5%
]
2.25%
46,63425.5%
[
2.0%
-
2.5%
]
2.49%
55,36823.7%
[
2.5%
-
3.0%
]
2.63%
53,14141.6%
[
2.5%
-
3.0%
]
2.94%
3,53515.6%
[
3.0%
-
3.5%
]
3.05%
25,17632.2%
[
3.0%
-
3.5%
]
3.22%
51,88335.7%
[
3.0%
-
3.5%
]
3.38%
66,90629.9%
[
3.5%
-
4.0%
]
3.55%
6,82533.8%
[
3.5%
-
4.0%
]
3.78%
50,80514.5%
[
4.0%
-
4.5%
]
4.17%
30,45019.3%
[
4.0%
-
4.5%
]
4.41%
12,42447.0%
[
4.5%
-
5.0%
]
4.55%
1,42914.9%
[
4.5%
-
5.0%
]
4.89%
99,80013.1%
[
5.0%
-
5.5%
]
5.04%
22,92524.0%
[
5.0%
-
5.5%
]
5.21%
8,41027.0%
[
5.0%
-
5.5%
]
5.40%
2,8152.3%
[
5.5%
-
6.0%
]
5.76%
7470.012%
[
5.5%
-
6.0%
]
5.97%
140,99431.6%
[
6.0%
-
6.5%
]
6.22%
8,81529.4%
[
6.5%
-
7.0%
]
6.58%
5,00011.6%
[
6.5%
-
7.0%
]
6.76%
14855.6%
[
6.5%
-
7.0%
]
6.99%
14351.9%
[
7.5%
-
8.0%
]
7.90%
6,93845.3%
[
8.5%
-
9.0%
]
8.83%
1,15511.9%
[
10.0%
-
10.5%
]
10.02%
5,75126.3%
[
13.0%
-
13.5%
]
13.49%
1,39439.3%
[
19.0%
-
19.5%
]
19.16%
98138.8%