Houma Wage/Income Gap
COMPARE
Houma
Select to Compare
Wage/Income Gap
Houma Wage/Income Gap
38.7%
WAGE/INCOME GAP
0.0/ 100
METRIC RATING
347th/ 347
METRIC RANK
Houma Wage/Income Gap Correlation Chart
The statistical analysis conducted on geographies consisting of 36,791,242 people shows a significant positive correlation between the proportion of Houma and wage/income gap percentage in the United States with a correlation coefficient (R) of 0.642 and weighted average of 38.7%. On average, for every 1% (one percent) increase in Houma within a typical geography, there is an increase of 0.92% in wage/income gap percentage.
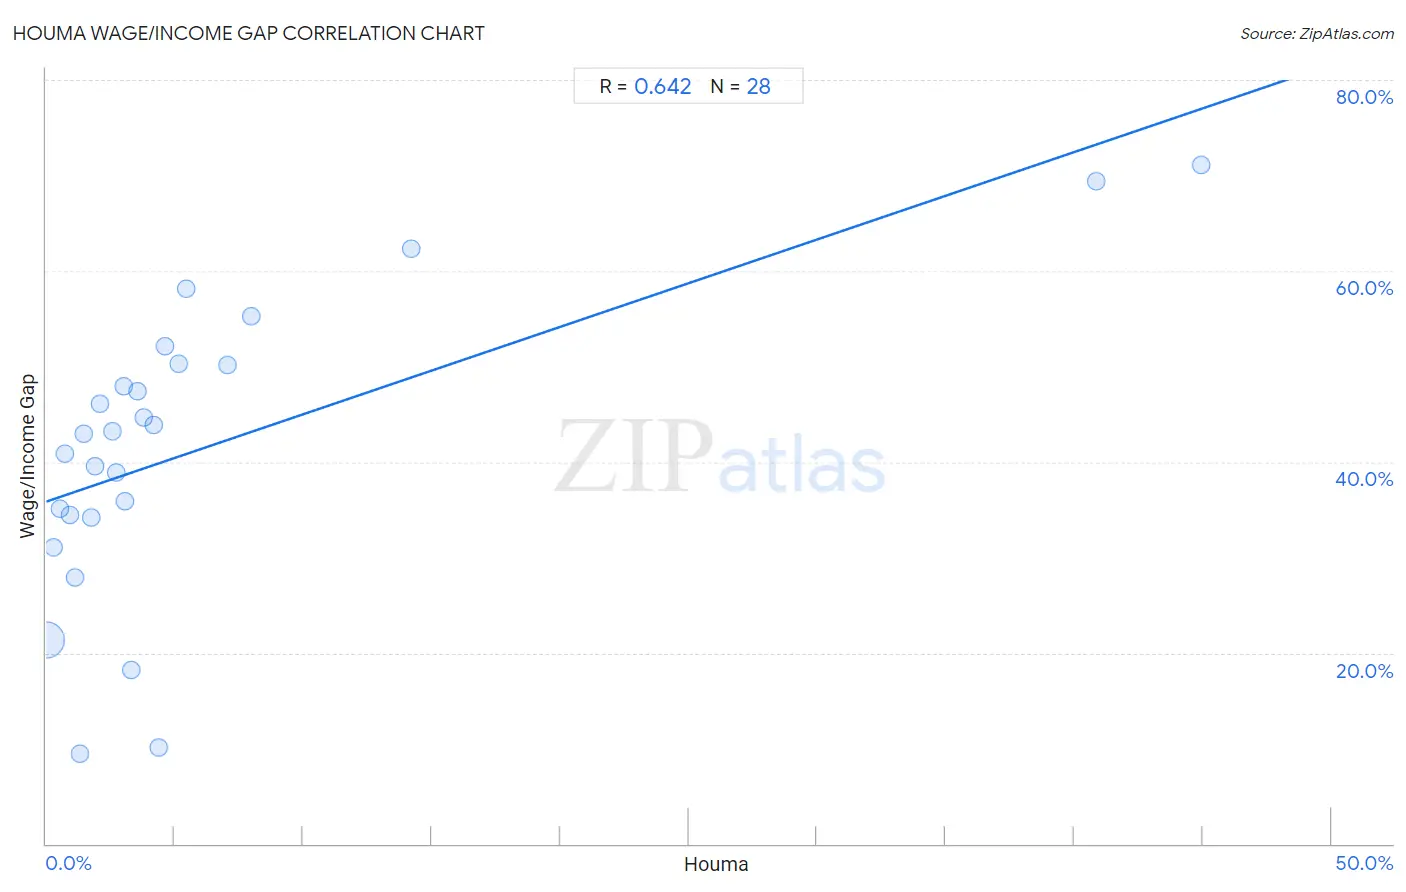
It is essential to understand that the correlation between the percentage of Houma and wage/income gap percentage does not imply a direct cause-and-effect relationship. It remains uncertain whether the presence of Houma influences an upward or downward trend in the level of wage/income gap percentage within an area, or if Houma simply ended up residing in those areas with higher or lower levels of wage/income gap percentage due to other factors.
Demographics Similar to Houma by Wage/Income Gap
In terms of wage/income gap, the demographic groups most similar to Houma are Cajun (33.9%, a difference of 14.1%), Immigrants from India (31.5%, a difference of 22.6%), Assyrian/Chaldean/Syriac (31.0%, a difference of 24.7%), Danish (31.0%, a difference of 24.9%), and Pennsylvania German (30.7%, a difference of 25.9%).
| Demographics | Rating | Rank | Wage/Income Gap |
| Europeans | 0.0 /100 | #333 | Tragic 29.4% |
| Swedes | 0.0 /100 | #334 | Tragic 29.4% |
| Immigrants from Taiwan | 0.0 /100 | #335 | Tragic 29.5% |
| English | 0.0 /100 | #336 | Tragic 29.5% |
| Dutch | 0.0 /100 | #337 | Tragic 29.6% |
| Filipinos | 0.0 /100 | #338 | Tragic 29.7% |
| Iranians | 0.0 /100 | #339 | Tragic 29.7% |
| Swiss | 0.0 /100 | #340 | Tragic 30.0% |
| Thais | 0.0 /100 | #341 | Tragic 30.5% |
| Pennsylvania Germans | 0.0 /100 | #342 | Tragic 30.7% |
| Danes | 0.0 /100 | #343 | Tragic 31.0% |
| Assyrians/Chaldeans/Syriacs | 0.0 /100 | #344 | Tragic 31.0% |
| Immigrants from India | 0.0 /100 | #345 | Tragic 31.5% |
| Cajuns | 0.0 /100 | #346 | Tragic 33.9% |
| Houma | 0.0 /100 | #347 | Tragic 38.7% |
Houma Wage/Income Gap Correlation Summary
| Measurement | Houma Data | Wage/Income Gap Data |
| Minimum | 0.012% | 9.5% |
| Maximum | 44.9% | 71.0% |
| Range | 44.9% | 61.6% |
| Mean | 6.2% | 41.5% |
| Median | 3.0% | 43.1% |
| Interquartile 25% (IQ1) | 1.4% | 34.3% |
| Interquartile 75% (IQ3) | 4.9% | 50.2% |
| Interquartile Range (IQR) | 3.5% | 15.9% |
| Standard Deviation (Sample) | 10.8% | 15.4% |
| Standard Deviation (Population) | 10.6% | 15.1% |
Correlation Details
| Houma Percentile | Sample Size | Wage/Income Gap |
[ 0.0% - 0.5% ] 0.012% | 35,258,017 | 21.3% |
[ 0.0% - 0.5% ] 0.28% | 573,742 | 31.1% |
[ 0.5% - 1.0% ] 0.52% | 304,570 | 35.1% |
[ 0.5% - 1.0% ] 0.71% | 265,274 | 40.8% |
[ 0.5% - 1.0% ] 0.93% | 85,949 | 34.4% |
[ 1.0% - 1.5% ] 1.10% | 41,757 | 27.9% |
[ 1.0% - 1.5% ] 1.32% | 4,545 | 9.5% |
[ 1.0% - 1.5% ] 1.47% | 24,952 | 43.0% |
[ 1.5% - 2.0% ] 1.77% | 15,031 | 34.2% |
[ 1.5% - 2.0% ] 1.89% | 10,157 | 39.6% |
[ 2.0% - 2.5% ] 2.09% | 8,600 | 46.1% |
[ 2.5% - 3.0% ] 2.58% | 9,287 | 43.3% |
[ 2.5% - 3.0% ] 2.71% | 7,961 | 38.9% |
[ 2.5% - 3.0% ] 3.00% | 26,788 | 47.9% |
[ 3.0% - 3.5% ] 3.09% | 5,118 | 35.9% |
[ 3.0% - 3.5% ] 3.31% | 5,619 | 18.2% |
[ 3.5% - 4.0% ] 3.56% | 33,094 | 47.4% |
[ 3.5% - 4.0% ] 3.79% | 15,373 | 44.7% |
[ 4.0% - 4.5% ] 4.21% | 11,624 | 43.9% |
[ 4.0% - 4.5% ] 4.40% | 2,386 | 10.0% |
[ 4.5% - 5.0% ] 4.63% | 30,192 | 52.1% |
[ 5.0% - 5.5% ] 5.16% | 35,760 | 50.2% |
[ 5.0% - 5.5% ] 5.46% | 5,845 | 58.2% |
[ 7.0% - 7.5% ] 7.04% | 3,762 | 50.2% |
[ 7.5% - 8.0% ] 7.99% | 2,880 | 55.2% |
[ 14.0% - 14.5% ] 14.18% | 1,347 | 62.3% |
[ 40.5% - 41.0% ] 40.88% | 844 | 69.4% |
[ 44.5% - 45.0% ] 44.92% | 768 | 71.0% |