Malaysian Wage/Income Gap
COMPARE
Malaysian
Select to Compare
Wage/Income Gap
Malaysian Wage/Income Gap
25.0%
WAGE/INCOME GAP
84.9/ 100
METRIC RATING
147th/ 347
METRIC RANK
Malaysian Wage/Income Gap Correlation Chart
The statistical analysis conducted on geographies consisting of 226,066,613 people shows a significant positive correlation between the proportion of Malaysians and wage/income gap percentage in the United States with a correlation coefficient (R) of 0.608 and weighted average of 25.0%. On average, for every 1% (one percent) increase in Malaysians within a typical geography, there is an increase of 1.7% in wage/income gap percentage.
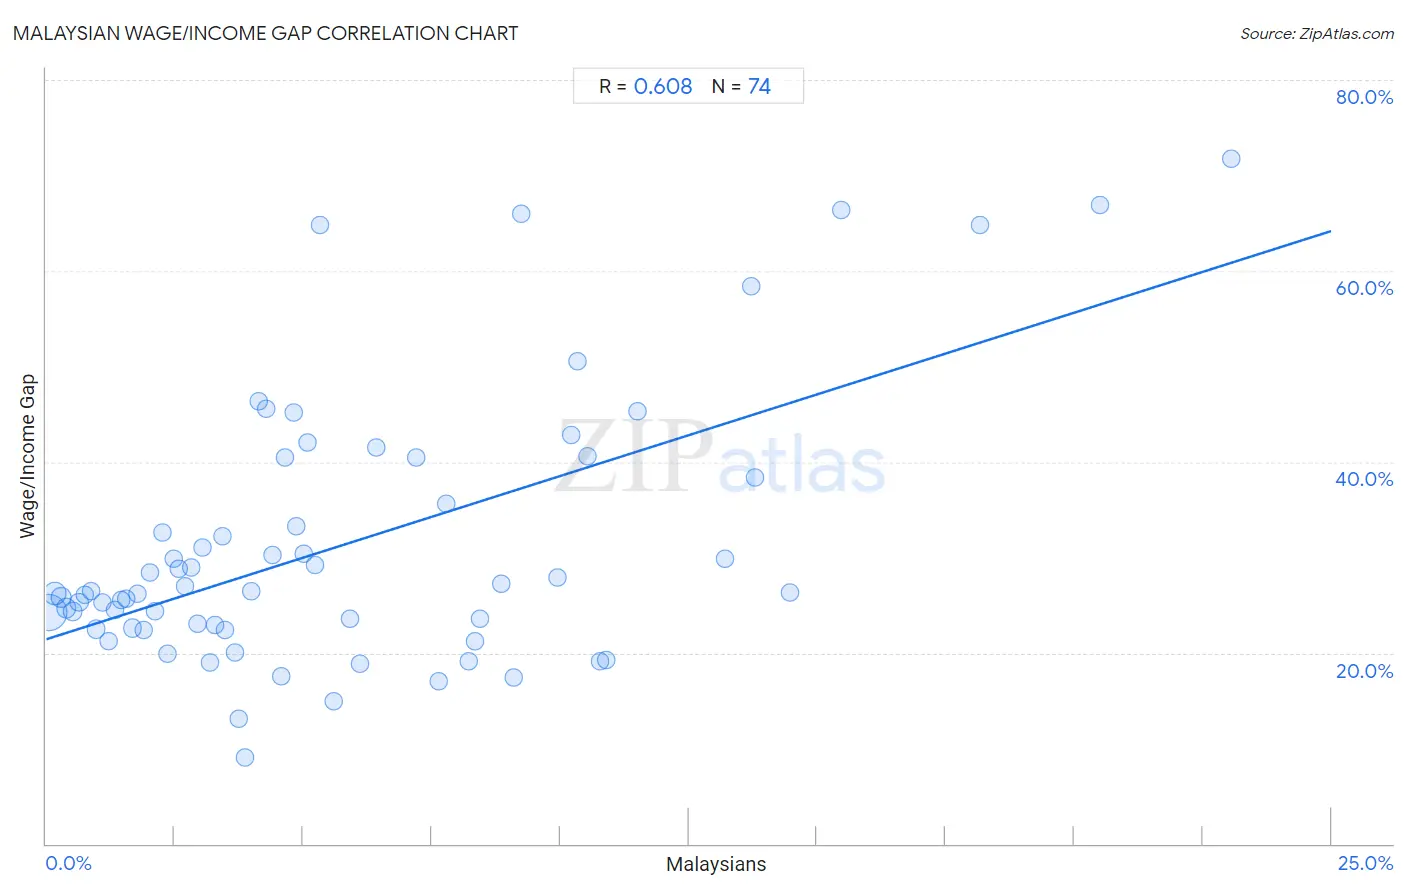
It is essential to understand that the correlation between the percentage of Malaysians and wage/income gap percentage does not imply a direct cause-and-effect relationship. It remains uncertain whether the presence of Malaysians influences an upward or downward trend in the level of wage/income gap percentage within an area, or if Malaysians simply ended up residing in those areas with higher or lower levels of wage/income gap percentage due to other factors.
Demographics Similar to Malaysians by Wage/Income Gap
In terms of wage/income gap, the demographic groups most similar to Malaysians are Comanche (25.0%, a difference of 0.030%), South American (25.0%, a difference of 0.030%), Iroquois (25.1%, a difference of 0.14%), Chippewa (25.0%, a difference of 0.27%), and Immigrants from Peru (25.1%, a difference of 0.28%).
| Demographics | Rating | Rank | Wage/Income Gap |
| Immigrants from Nepal | 89.3 /100 | #140 | Excellent 24.9% |
| Hawaiians | 89.3 /100 | #141 | Excellent 24.9% |
| Afghans | 88.1 /100 | #142 | Excellent 24.9% |
| Immigrants from Uganda | 88.0 /100 | #143 | Excellent 24.9% |
| Chippewa | 86.9 /100 | #144 | Excellent 25.0% |
| Comanche | 85.2 /100 | #145 | Excellent 25.0% |
| South Americans | 85.2 /100 | #146 | Excellent 25.0% |
| Malaysians | 84.9 /100 | #147 | Excellent 25.0% |
| Iroquois | 83.9 /100 | #148 | Excellent 25.1% |
| Immigrants from Peru | 82.6 /100 | #149 | Excellent 25.1% |
| Immigrants | 82.3 /100 | #150 | Excellent 25.1% |
| Taiwanese | 81.6 /100 | #151 | Excellent 25.1% |
| Uruguayans | 81.3 /100 | #152 | Excellent 25.2% |
| Blackfeet | 78.1 /100 | #153 | Good 25.2% |
| Immigrants from Northern Africa | 78.1 /100 | #154 | Good 25.2% |
Malaysian Wage/Income Gap Correlation Summary
| Measurement | Malaysian Data | Wage/Income Gap Data |
| Minimum | 0.044% | 9.0% |
| Maximum | 23.0% | 71.7% |
| Range | 23.0% | 62.7% |
| Mean | 5.8% | 31.3% |
| Median | 4.3% | 26.4% |
| Interquartile 25% (IQ1) | 2.1% | 22.6% |
| Interquartile 75% (IQ3) | 8.4% | 38.4% |
| Interquartile Range (IQR) | 6.3% | 15.8% |
| Standard Deviation (Sample) | 5.0% | 14.0% |
| Standard Deviation (Population) | 4.9% | 13.9% |
Correlation Details
| Malaysian Percentile | Sample Size | Wage/Income Gap |
[ 0.0% - 0.5% ] 0.044% | 134,156,774 | 24.3% |
[ 0.0% - 0.5% ] 0.17% | 38,982,715 | 26.2% |
[ 0.0% - 0.5% ] 0.28% | 19,163,918 | 25.8% |
[ 0.0% - 0.5% ] 0.39% | 9,269,675 | 24.7% |
[ 0.5% - 1.0% ] 0.52% | 6,698,014 | 24.4% |
[ 0.5% - 1.0% ] 0.64% | 3,614,637 | 25.3% |
[ 0.5% - 1.0% ] 0.74% | 2,415,606 | 26.0% |
[ 0.5% - 1.0% ] 0.87% | 1,943,035 | 26.5% |
[ 0.5% - 1.0% ] 0.97% | 2,171,793 | 22.5% |
[ 1.0% - 1.5% ] 1.09% | 884,006 | 25.3% |
[ 1.0% - 1.5% ] 1.21% | 1,577,090 | 21.3% |
[ 1.0% - 1.5% ] 1.34% | 872,908 | 24.4% |
[ 1.0% - 1.5% ] 1.45% | 463,548 | 25.5% |
[ 1.5% - 2.0% ] 1.55% | 612,695 | 25.6% |
[ 1.5% - 2.0% ] 1.67% | 752,772 | 22.6% |
[ 1.5% - 2.0% ] 1.77% | 301,681 | 26.2% |
[ 1.5% - 2.0% ] 1.89% | 272,383 | 22.4% |
[ 2.0% - 2.5% ] 2.02% | 202,170 | 28.4% |
[ 2.0% - 2.5% ] 2.11% | 271,946 | 24.3% |
[ 2.0% - 2.5% ] 2.26% | 94,545 | 32.5% |
[ 2.0% - 2.5% ] 2.36% | 188,445 | 19.9% |
[ 2.0% - 2.5% ] 2.48% | 209,361 | 29.8% |
[ 2.5% - 3.0% ] 2.58% | 111,060 | 28.9% |
[ 2.5% - 3.0% ] 2.71% | 42,764 | 27.0% |
[ 2.5% - 3.0% ] 2.83% | 163,649 | 29.0% |
[ 2.5% - 3.0% ] 2.94% | 195,376 | 23.0% |
[ 3.0% - 3.5% ] 3.03% | 102,188 | 31.0% |
[ 3.0% - 3.5% ] 3.20% | 27,756 | 18.9% |
[ 3.0% - 3.5% ] 3.28% | 43,282 | 22.9% |
[ 3.0% - 3.5% ] 3.42% | 3,219 | 32.2% |
[ 3.0% - 3.5% ] 3.47% | 27,020 | 22.4% |
[ 3.5% - 4.0% ] 3.66% | 18,104 | 20.0% |
[ 3.5% - 4.0% ] 3.75% | 32,829 | 13.1% |
[ 3.5% - 4.0% ] 3.86% | 18,516 | 9.0% |
[ 3.5% - 4.0% ] 3.99% | 1,429 | 26.4% |
[ 4.0% - 4.5% ] 4.14% | 1,955 | 46.3% |
[ 4.0% - 4.5% ] 4.28% | 11,587 | 45.6% |
[ 4.0% - 4.5% ] 4.41% | 3,927 | 30.2% |
[ 4.5% - 5.0% ] 4.58% | 19,389 | 17.5% |
[ 4.5% - 5.0% ] 4.64% | 2,845 | 40.4% |
[ 4.5% - 5.0% ] 4.82% | 2,262 | 45.2% |
[ 4.5% - 5.0% ] 4.87% | 6,511 | 33.3% |
[ 5.0% - 5.5% ] 5.02% | 7,674 | 30.4% |
[ 5.0% - 5.5% ] 5.09% | 2,063 | 42.0% |
[ 5.0% - 5.5% ] 5.22% | 8,567 | 29.1% |
[ 5.0% - 5.5% ] 5.33% | 3,582 | 64.9% |
[ 5.5% - 6.0% ] 5.59% | 1,826 | 14.9% |
[ 5.5% - 6.0% ] 5.91% | 8,788 | 23.6% |
[ 6.0% - 6.5% ] 6.10% | 541 | 18.8% |
[ 6.0% - 6.5% ] 6.42% | 2,539 | 41.5% |
[ 7.0% - 7.5% ] 7.19% | 1,460 | 40.5% |
[ 7.5% - 8.0% ] 7.63% | 22,539 | 17.0% |
[ 7.5% - 8.0% ] 7.79% | 578 | 35.6% |
[ 8.0% - 8.5% ] 8.21% | 15,355 | 19.2% |
[ 8.0% - 8.5% ] 8.33% | 216 | 21.3% |
[ 8.0% - 8.5% ] 8.44% | 2,819 | 23.6% |
[ 8.5% - 9.0% ] 8.85% | 610 | 27.3% |
[ 9.0% - 9.5% ] 9.10% | 13,838 | 17.5% |
[ 9.0% - 9.5% ] 9.24% | 1,407 | 66.0% |
[ 9.5% - 10.0% ] 9.95% | 191 | 27.9% |
[ 10.0% - 10.5% ] 10.21% | 2,595 | 42.8% |
[ 10.0% - 10.5% ] 10.34% | 861 | 50.6% |
[ 10.5% - 11.0% ] 10.54% | 389 | 40.6% |
[ 10.5% - 11.0% ] 10.78% | 2,207 | 19.1% |
[ 10.5% - 11.0% ] 10.90% | 991 | 19.2% |
[ 11.0% - 11.5% ] 11.49% | 87 | 45.3% |
[ 13.0% - 13.5% ] 13.21% | 106 | 29.9% |
[ 13.5% - 14.0% ] 13.71% | 2,984 | 58.5% |
[ 13.5% - 14.0% ] 13.79% | 1,900 | 38.4% |
[ 14.0% - 14.5% ] 14.47% | 1,693 | 26.3% |
[ 15.0% - 15.5% ] 15.46% | 679 | 66.3% |
[ 18.0% - 18.5% ] 18.16% | 1,052 | 64.8% |
[ 20.0% - 20.5% ] 20.49% | 527 | 66.9% |
[ 23.0% - 23.5% ] 23.05% | 564 | 71.7% |