Crow Wage/Income Gap
COMPARE
Crow
Select to Compare
Wage/Income Gap
Crow Wage/Income Gap
19.1%
WAGE/INCOME GAP
100.0/ 100
METRIC RATING
10th/ 347
METRIC RANK
Crow Wage/Income Gap Correlation Chart
The statistical analysis conducted on geographies consisting of 59,182,820 people shows a weak negative correlation between the proportion of Crow and wage/income gap percentage in the United States with a correlation coefficient (R) of -0.271 and weighted average of 19.1%. On average, for every 1% (one percent) increase in Crow within a typical geography, there is a decrease of 0.13% in wage/income gap percentage.
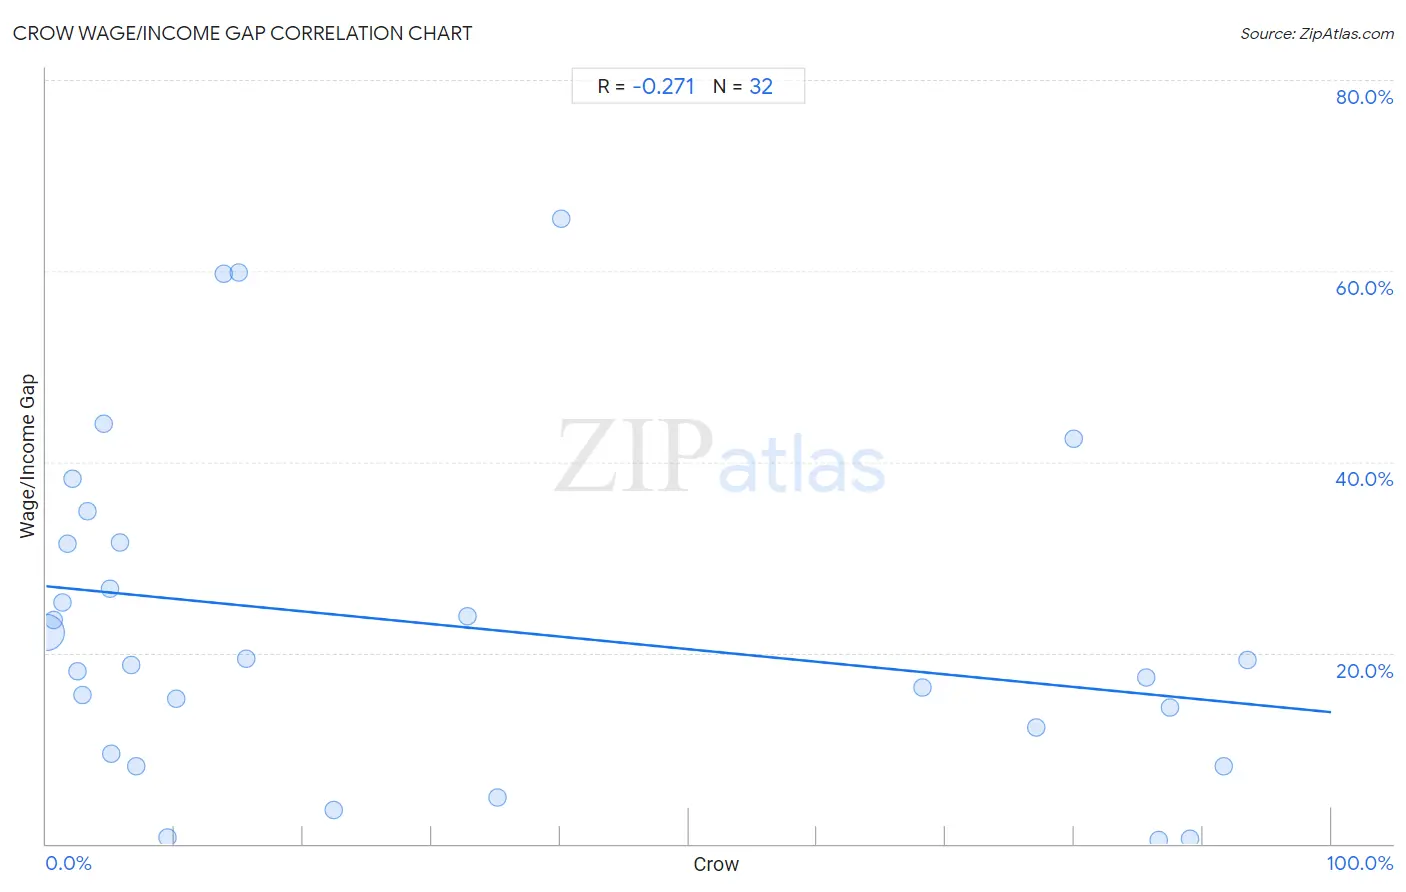
It is essential to understand that the correlation between the percentage of Crow and wage/income gap percentage does not imply a direct cause-and-effect relationship. It remains uncertain whether the presence of Crow influences an upward or downward trend in the level of wage/income gap percentage within an area, or if Crow simply ended up residing in those areas with higher or lower levels of wage/income gap percentage due to other factors.
Demographics Similar to Crow by Wage/Income Gap
In terms of wage/income gap, the demographic groups most similar to Crow are Barbadian (19.0%, a difference of 0.53%), Immigrants from Haiti (19.2%, a difference of 0.79%), Immigrants from West Indies (19.2%, a difference of 0.90%), Immigrants from Jamaica (18.8%, a difference of 1.2%), and Trinidadian and Tobagonian (19.3%, a difference of 1.4%).
| Demographics | Rating | Rank | Wage/Income Gap |
| Immigrants from Barbados | 100.0 /100 | #3 | Exceptional 17.8% |
| British West Indians | 100.0 /100 | #4 | Exceptional 18.0% |
| Guyanese | 100.0 /100 | #5 | Exceptional 18.3% |
| Immigrants from Guyana | 100.0 /100 | #6 | Exceptional 18.4% |
| Puerto Ricans | 100.0 /100 | #7 | Exceptional 18.7% |
| Immigrants from Jamaica | 100.0 /100 | #8 | Exceptional 18.8% |
| Barbadians | 100.0 /100 | #9 | Exceptional 19.0% |
| Crow | 100.0 /100 | #10 | Exceptional 19.1% |
| Immigrants from Haiti | 100.0 /100 | #11 | Exceptional 19.2% |
| Immigrants from West Indies | 100.0 /100 | #12 | Exceptional 19.2% |
| Trinidadians and Tobagonians | 100.0 /100 | #13 | Exceptional 19.3% |
| Immigrants from Trinidad and Tobago | 100.0 /100 | #14 | Exceptional 19.3% |
| West Indians | 100.0 /100 | #15 | Exceptional 19.6% |
| Jamaicans | 100.0 /100 | #16 | Exceptional 19.6% |
| Haitians | 100.0 /100 | #17 | Exceptional 19.7% |
Crow Wage/Income Gap Correlation Summary
| Measurement | Crow Data | Wage/Income Gap Data |
| Minimum | 0.023% | 0.39% |
| Maximum | 93.4% | 65.5% |
| Range | 93.4% | 65.1% |
| Mean | 31.3% | 22.8% |
| Median | 11.9% | 19.0% |
| Interquartile 25% (IQ1) | 3.9% | 10.8% |
| Interquartile 75% (IQ3) | 72.7% | 31.5% |
| Interquartile Range (IQR) | 68.8% | 20.7% |
| Standard Deviation (Sample) | 35.3% | 17.2% |
| Standard Deviation (Population) | 34.8% | 16.9% |
Correlation Details
| Crow Percentile | Sample Size | Wage/Income Gap |
[ 0.0% - 0.5% ] 0.023% | 58,528,182 | 22.2% |
[ 0.5% - 1.0% ] 0.59% | 289,716 | 23.4% |
[ 1.0% - 1.5% ] 1.26% | 165,939 | 25.3% |
[ 1.5% - 2.0% ] 1.61% | 92,840 | 31.4% |
[ 2.0% - 2.5% ] 2.07% | 7,192 | 38.3% |
[ 2.0% - 2.5% ] 2.45% | 49,253 | 18.1% |
[ 2.5% - 3.0% ] 2.85% | 1,893 | 15.5% |
[ 3.0% - 3.5% ] 3.25% | 9,750 | 34.9% |
[ 4.0% - 4.5% ] 4.46% | 202 | 43.9% |
[ 4.5% - 5.0% ] 4.97% | 5,276 | 26.7% |
[ 5.0% - 5.5% ] 5.10% | 1,019 | 9.4% |
[ 5.5% - 6.0% ] 5.76% | 1,440 | 31.6% |
[ 6.5% - 7.0% ] 6.62% | 3,914 | 18.7% |
[ 7.0% - 7.5% ] 7.01% | 785 | 8.1% |
[ 9.0% - 9.5% ] 9.45% | 2,064 | 0.62% |
[ 10.0% - 10.5% ] 10.08% | 2,817 | 15.2% |
[ 13.5% - 14.0% ] 13.79% | 428 | 59.8% |
[ 15.0% - 15.5% ] 15.00% | 40 | 59.8% |
[ 15.5% - 16.0% ] 15.56% | 1,125 | 19.4% |
[ 22.0% - 22.5% ] 22.35% | 783 | 3.5% |
[ 32.5% - 33.0% ] 32.75% | 3,985 | 23.8% |
[ 35.0% - 35.5% ] 35.12% | 5,199 | 4.9% |
[ 40.0% - 40.5% ] 40.12% | 172 | 65.5% |
[ 68.0% - 68.5% ] 68.23% | 576 | 16.4% |
[ 77.0% - 77.5% ] 77.09% | 1,602 | 12.2% |
[ 79.5% - 80.0% ] 79.96% | 459 | 42.4% |
[ 85.5% - 86.0% ] 85.61% | 660 | 17.4% |
[ 86.5% - 87.0% ] 86.61% | 2,180 | 0.39% |
[ 87.0% - 87.5% ] 87.40% | 262 | 14.3% |
[ 89.0% - 89.5% ] 89.03% | 629 | 0.57% |
[ 91.5% - 92.0% ] 91.65% | 1,965 | 8.1% |
[ 93.0% - 93.5% ] 93.45% | 473 | 19.3% |