Ethiopian Wage/Income Gap
COMPARE
Ethiopian
Select to Compare
Wage/Income Gap
Ethiopian Wage/Income Gap
21.8%
WAGE/INCOME GAP
100.0/ 100
METRIC RATING
49th/ 347
METRIC RANK
Ethiopian Wage/Income Gap Correlation Chart
The statistical analysis conducted on geographies consisting of 223,211,897 people shows a weak positive correlation between the proportion of Ethiopians and wage/income gap percentage in the United States with a correlation coefficient (R) of 0.274 and weighted average of 21.8%. On average, for every 1% (one percent) increase in Ethiopians within a typical geography, there is an increase of 0.61% in wage/income gap percentage.
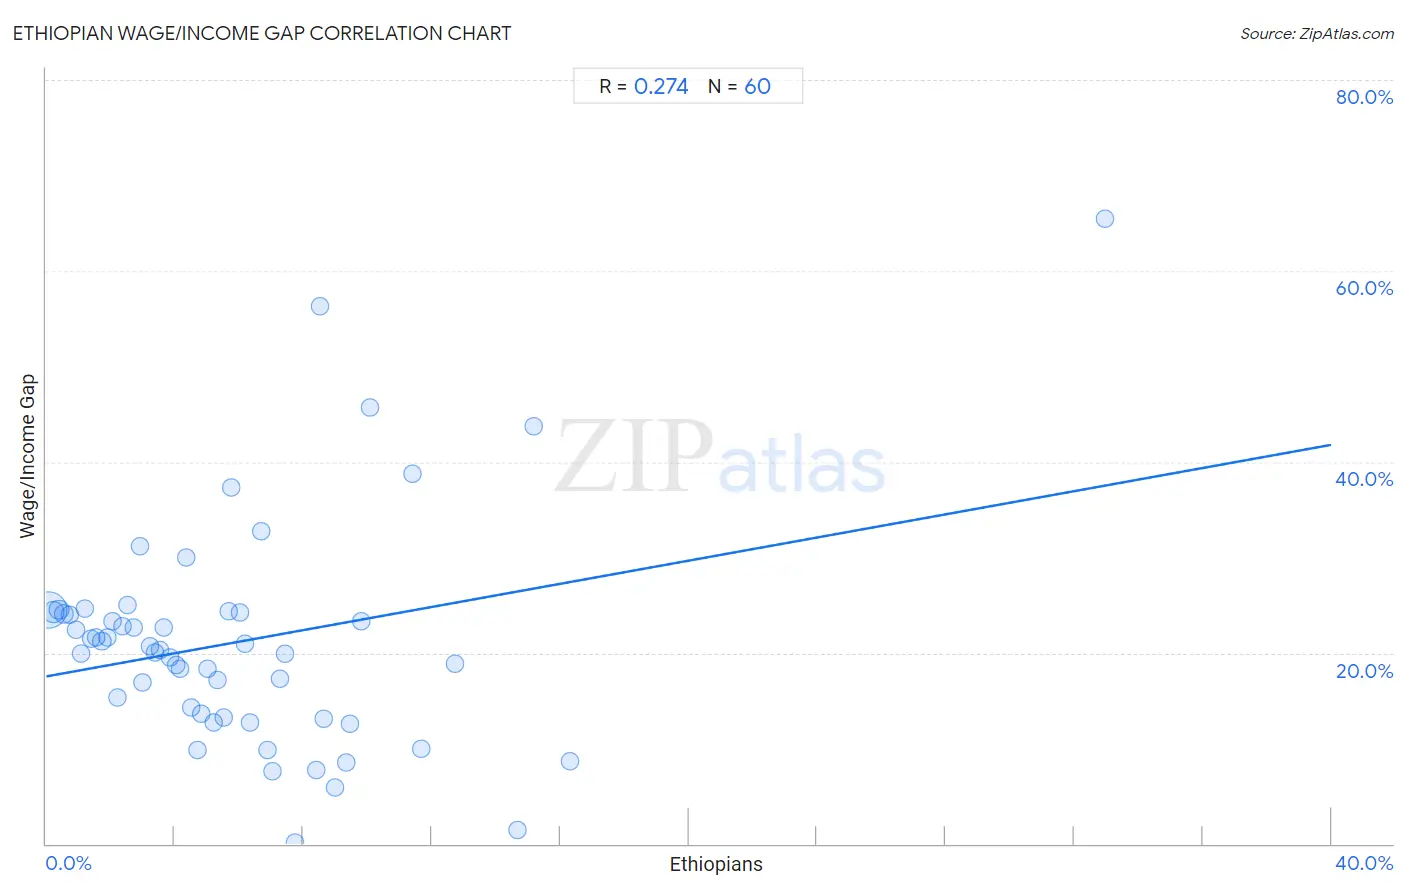
It is essential to understand that the correlation between the percentage of Ethiopians and wage/income gap percentage does not imply a direct cause-and-effect relationship. It remains uncertain whether the presence of Ethiopians influences an upward or downward trend in the level of wage/income gap percentage within an area, or if Ethiopians simply ended up residing in those areas with higher or lower levels of wage/income gap percentage due to other factors.
Demographics Similar to Ethiopians by Wage/Income Gap
In terms of wage/income gap, the demographic groups most similar to Ethiopians are Black/African American (21.7%, a difference of 0.51%), Immigrants from Congo (21.7%, a difference of 0.69%), Immigrants from Western Africa (22.0%, a difference of 0.98%), Immigrants from Ethiopia (21.6%, a difference of 1.3%), and U.S. Virgin Islander (21.5%, a difference of 1.4%).
| Demographics | Rating | Rank | Wage/Income Gap |
| Immigrants from Sierra Leone | 100.0 /100 | #42 | Exceptional 21.4% |
| Sierra Leoneans | 100.0 /100 | #43 | Exceptional 21.4% |
| Immigrants from Eritrea | 100.0 /100 | #44 | Exceptional 21.4% |
| U.S. Virgin Islanders | 100.0 /100 | #45 | Exceptional 21.5% |
| Immigrants from Ethiopia | 100.0 /100 | #46 | Exceptional 21.6% |
| Immigrants from Congo | 100.0 /100 | #47 | Exceptional 21.7% |
| Blacks/African Americans | 100.0 /100 | #48 | Exceptional 21.7% |
| Ethiopians | 100.0 /100 | #49 | Exceptional 21.8% |
| Immigrants from Western Africa | 100.0 /100 | #50 | Exceptional 22.0% |
| Tohono O'odham | 100.0 /100 | #51 | Exceptional 22.1% |
| Immigrants from Cameroon | 100.0 /100 | #52 | Exceptional 22.2% |
| Bangladeshis | 100.0 /100 | #53 | Exceptional 22.2% |
| Nepalese | 100.0 /100 | #54 | Exceptional 22.2% |
| Immigrants from Zaire | 100.0 /100 | #55 | Exceptional 22.3% |
| Immigrants from Ghana | 100.0 /100 | #56 | Exceptional 22.3% |
Ethiopian Wage/Income Gap Correlation Summary
| Measurement | Ethiopian Data | Wage/Income Gap Data |
| Minimum | 0.064% | 0.11% |
| Maximum | 33.0% | 65.4% |
| Range | 32.9% | 65.3% |
| Mean | 5.9% | 21.1% |
| Median | 4.9% | 20.5% |
| Interquartile 25% (IQ1) | 2.5% | 13.4% |
| Interquartile 75% (IQ3) | 8.1% | 24.2% |
| Interquartile Range (IQR) | 5.6% | 10.8% |
| Standard Deviation (Sample) | 5.3% | 11.6% |
| Standard Deviation (Population) | 5.2% | 11.5% |
Correlation Details
| Ethiopian Percentile | Sample Size | Wage/Income Gap |
[ 0.0% - 0.5% ] 0.064% | 143,238,561 | 24.4% |
[ 0.0% - 0.5% ] 0.22% | 34,856,458 | 24.3% |
[ 0.0% - 0.5% ] 0.40% | 14,248,870 | 24.5% |
[ 0.5% - 1.0% ] 0.56% | 7,870,861 | 24.1% |
[ 0.5% - 1.0% ] 0.74% | 3,680,070 | 24.0% |
[ 0.5% - 1.0% ] 0.91% | 3,648,446 | 22.4% |
[ 1.0% - 1.5% ] 1.08% | 2,842,447 | 19.9% |
[ 1.0% - 1.5% ] 1.21% | 2,514,164 | 24.6% |
[ 1.0% - 1.5% ] 1.41% | 1,583,133 | 21.5% |
[ 1.5% - 2.0% ] 1.56% | 1,750,526 | 21.6% |
[ 1.5% - 2.0% ] 1.73% | 964,864 | 21.2% |
[ 1.5% - 2.0% ] 1.89% | 804,107 | 21.6% |
[ 2.0% - 2.5% ] 2.07% | 384,379 | 23.3% |
[ 2.0% - 2.5% ] 2.21% | 545,505 | 15.3% |
[ 2.0% - 2.5% ] 2.39% | 176,307 | 22.8% |
[ 2.5% - 3.0% ] 2.55% | 381,336 | 25.1% |
[ 2.5% - 3.0% ] 2.73% | 261,454 | 22.7% |
[ 2.5% - 3.0% ] 2.92% | 211,644 | 31.1% |
[ 3.0% - 3.5% ] 3.00% | 469,301 | 16.9% |
[ 3.0% - 3.5% ] 3.22% | 235,328 | 20.7% |
[ 3.0% - 3.5% ] 3.38% | 286,416 | 20.1% |
[ 3.5% - 4.0% ] 3.54% | 229,912 | 20.3% |
[ 3.5% - 4.0% ] 3.65% | 62,039 | 22.6% |
[ 3.5% - 4.0% ] 3.84% | 100,273 | 19.5% |
[ 4.0% - 4.5% ] 4.03% | 156,701 | 18.7% |
[ 4.0% - 4.5% ] 4.18% | 125,408 | 18.4% |
[ 4.0% - 4.5% ] 4.36% | 78,603 | 30.0% |
[ 4.5% - 5.0% ] 4.52% | 264,356 | 14.3% |
[ 4.5% - 5.0% ] 4.71% | 48,890 | 9.8% |
[ 4.5% - 5.0% ] 4.82% | 84,569 | 13.6% |
[ 5.0% - 5.5% ] 5.03% | 130,801 | 18.3% |
[ 5.0% - 5.5% ] 5.23% | 164,550 | 12.7% |
[ 5.0% - 5.5% ] 5.33% | 55,439 | 17.1% |
[ 5.5% - 6.0% ] 5.53% | 94,052 | 13.3% |
[ 5.5% - 6.0% ] 5.69% | 26,996 | 24.3% |
[ 5.5% - 6.0% ] 5.78% | 4,017 | 37.4% |
[ 6.0% - 6.5% ] 6.02% | 26,595 | 24.2% |
[ 6.0% - 6.5% ] 6.18% | 45,072 | 20.9% |
[ 6.0% - 6.5% ] 6.33% | 44,863 | 12.7% |
[ 6.5% - 7.0% ] 6.71% | 14,098 | 32.7% |
[ 6.5% - 7.0% ] 6.89% | 61,169 | 9.8% |
[ 7.0% - 7.5% ] 7.05% | 24,581 | 7.5% |
[ 7.0% - 7.5% ] 7.28% | 101,620 | 17.3% |
[ 7.0% - 7.5% ] 7.43% | 26,573 | 19.9% |
[ 7.5% - 8.0% ] 7.74% | 18,324 | 0.11% |
[ 8.0% - 8.5% ] 8.40% | 30,927 | 7.7% |
[ 8.5% - 9.0% ] 8.52% | 587 | 56.4% |
[ 8.5% - 9.0% ] 8.65% | 64,730 | 13.1% |
[ 8.5% - 9.0% ] 8.97% | 535 | 5.9% |
[ 9.0% - 9.5% ] 9.36% | 25,823 | 8.6% |
[ 9.0% - 9.5% ] 9.44% | 50,049 | 12.5% |
[ 9.5% - 10.0% ] 9.81% | 38,318 | 23.2% |
[ 10.0% - 10.5% ] 10.10% | 1,050 | 45.7% |
[ 11.0% - 11.5% ] 11.38% | 5,359 | 38.7% |
[ 11.5% - 12.0% ] 11.67% | 26,684 | 9.9% |
[ 12.5% - 13.0% ] 12.73% | 1,885 | 18.8% |
[ 14.5% - 15.0% ] 14.66% | 3,514 | 1.4% |
[ 15.0% - 15.5% ] 15.16% | 4,023 | 43.7% |
[ 16.0% - 16.5% ] 16.31% | 14,553 | 8.7% |
[ 32.5% - 33.0% ] 32.97% | 182 | 65.4% |